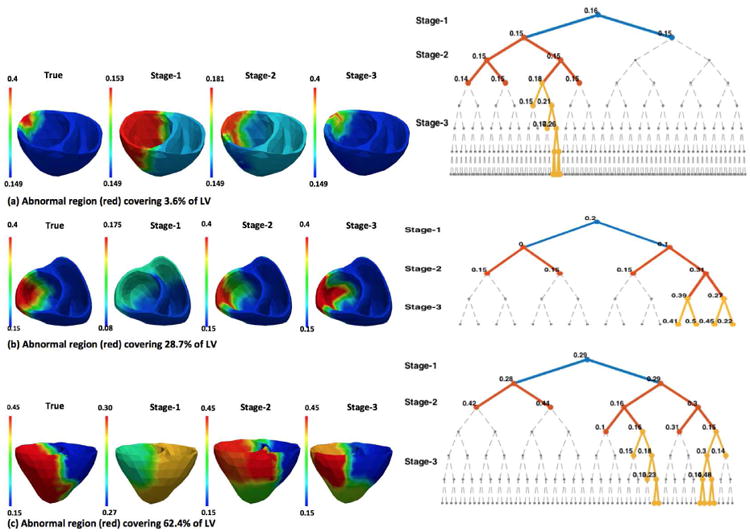
Fig. 5.

Synthetic experiments. Examples of the progression of the presented spatially-adaptive multi-scale optimization. Left: true parameter settings vs. estimation results improved over 3 successive stages of the optimization (red: infarcted tissue, blue: healthy tissue). Right: the corresponding structure of the tree at each stage. The value on each node of the tree represents the optimized parameter value for that node.
