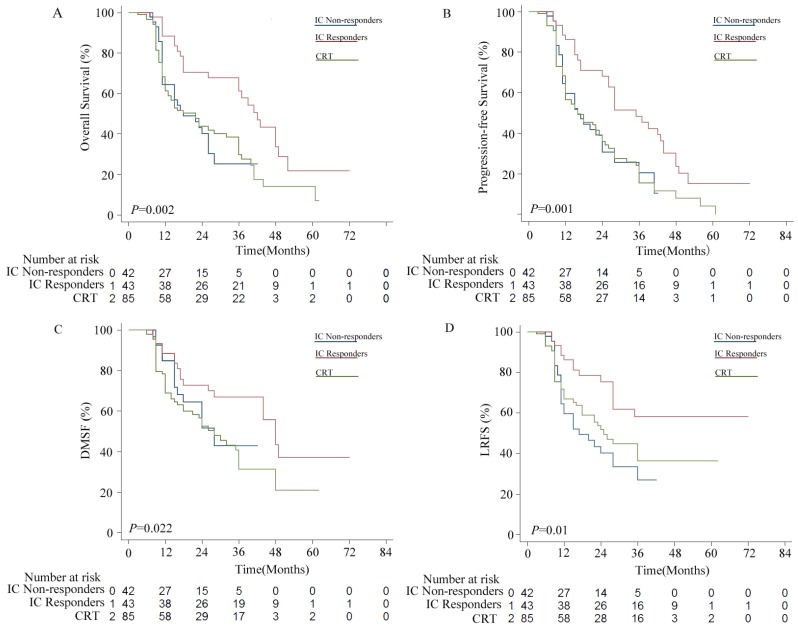
Figure 2.
Kaplan-Meier survival curves for the induction chemotherapy (IC) non-responder group versus the IC responder group versus the chemoradiotherapy (CRT group). (A) Overall survival (OS); (B) Progression free survival (PFS); (C) distant metastasis-free survival (DMFS); (D) locoregional relapse-free survival (LRFS).

