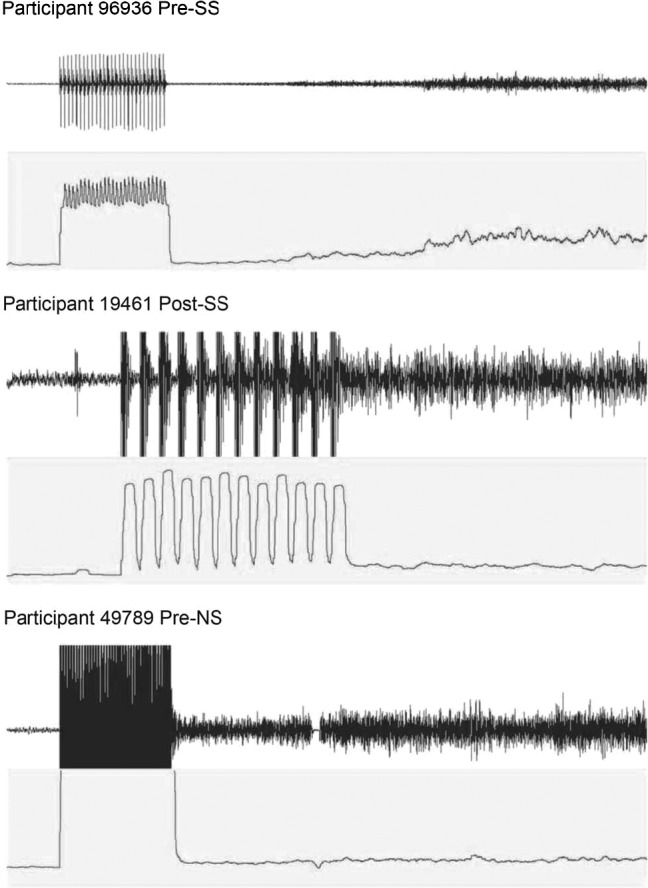
Figure 1. .

Electromyography and root mean square data for 3 participants. The top graph shows the raw electromyographic data at rest, stimulation, and during the electrically induced muscle cramp. The bottom graph shows the root mean square data during the same time frame.
