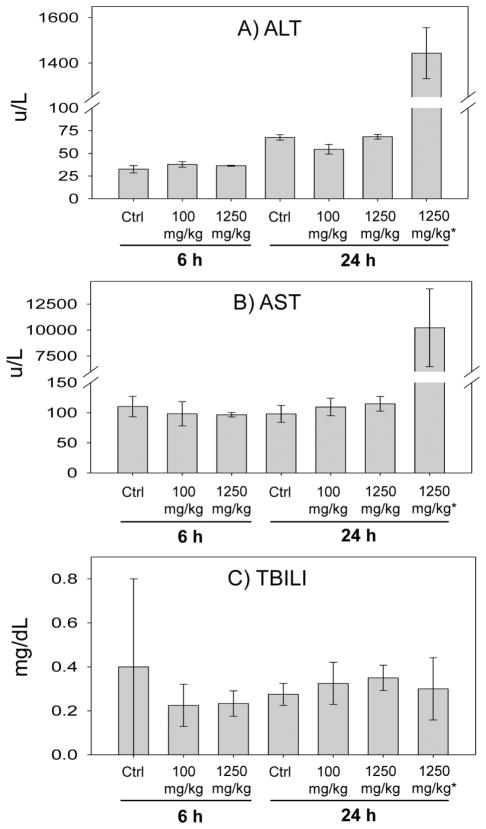
Figure 2.
Levels of serum ALT, AST, and total bilirubin (TBILI) in the control and the rats at 6- and 24-h posttreatment with low (100 mg/kg) and high (1250 mg/kg) doses of APAP. *The two rats with elevated serum ALT and AST levels are displayed separately from the other rats treated with the same high dose of APAP (1250 mg/kg). N = 4 except for the two rats in the 24 h, 1250 mg/kg treatment group with elevated serum ALT and AST levels.

