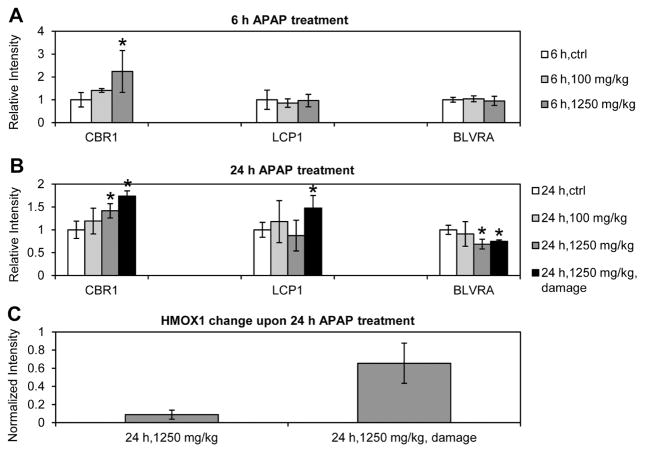
Figure 5.
Western blot analysis of protein expression changes upon APAP treatment. Expression of CBR1, LCP1, and BLVRA at 6-h (A) and 24-h (B) post-APAP treatment. (C) HMOX1 expression at 24-h post-APAP treatment with a dose of 1250 mg/kg. Protein band intensity was normalized by the loading control (β-actin). The normalized intensity was compared to the APAP treatment control and expressed as a relative intensity or fold change to the control. Standard deviation was calculated, and t-test was performed comparing to the control sample. *p < 0.05. N = 2 in the 24 h, 1250 mg/kg treatment group with elevated serum ALT and AST levels (24 h, 1250 mg/kg, damage). For all the other treatment and control groups, n = 4. HMOX1 protein was detected only in the high dose groups at 24-h post-APAP treatment, thus only normalized intensities are displayed.

