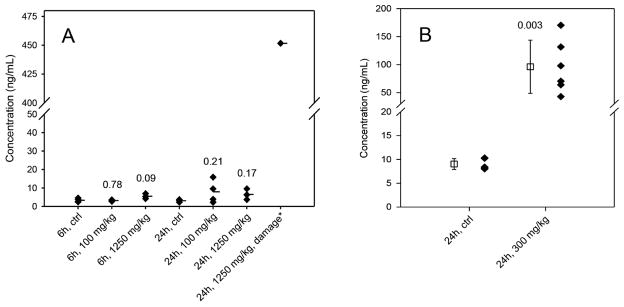
Figure 6.
The plasma protein concentrations (ng/mL) of HMOX1 measured by ELISA. (A) Plasma HMOX1 levels from the control and the rats at 6- or 24-h post-APAP treatment with a dose of 100 or 1250 mg/kg. The average concentrations are marked as the horizontal bars (−). *The group with elevated serum ALT and AST levels. (B) Plasma HMOX1 levels from the control and the mice at 24-h post-APAP injection with a dose of 300 mg/kg. The square with error bars is mean ± SD for each group. The numbers displayed in the graph A and B are the p-values from the t-test comparing to the control groups.

