
FIGURE 1.
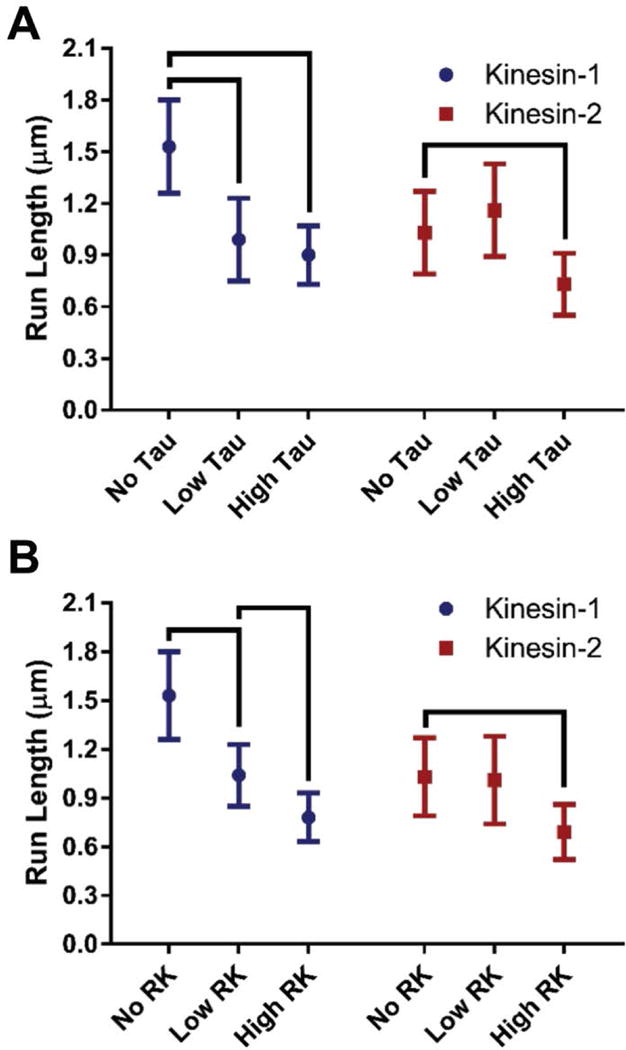
Characteristic run length comparisons between kinesin-1 and kinesin-2 in the absence and presence of microtubule obstacles. Two concentrations of (A) Tau or (B) rigor kinesin (RK) obstacles were used. Characteristic run length values were calculated from 38, the error bars represent the 99% confidence interval and the brackets represent significance between groups (p-value < 0.01) 38. (See Materials and Methods for further details.)