
FIGURE 2.
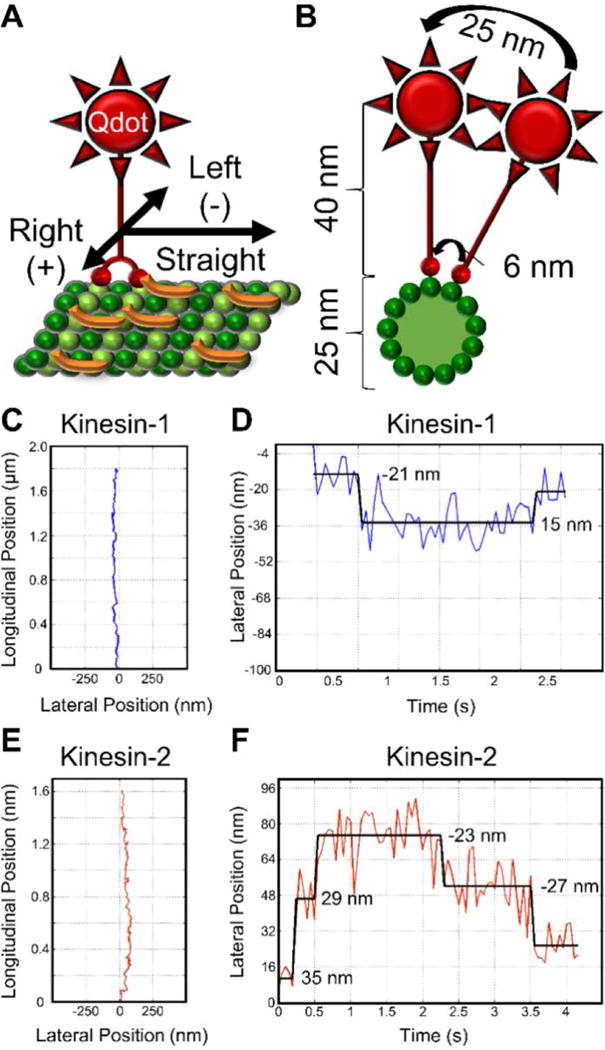
Experimental design and example kinesin protofilament switch trajectories. (A) Schematic of Qdot labeled kinesin motor (red) stepping along a Tau (orange) decorated microtubule (green). Left and right displacements are represented by negative and positive numbers, respectively. (B) Cross-section of panel A, illustrating the large lateral displacement of the C-terminally positioned Qdot relative to the motor domain displacement, which enables reliable detection of protofilament switches. (C) Example kinesin-1 trajectory longitudinal position vs lateral position and (D) kinesin-1 lateral position vs time (1.1 protofilament switches per micron). (E) Example kinesin-2 trajectory longitudinal position vs lateral position and (F) kinesin-2 lateral position vs time (2.5 protofilament switches per micron). In panels D and F, numbers represent lateral displacement and black lines represent the fit from the step finding algorithm.