
FIGURE 3.
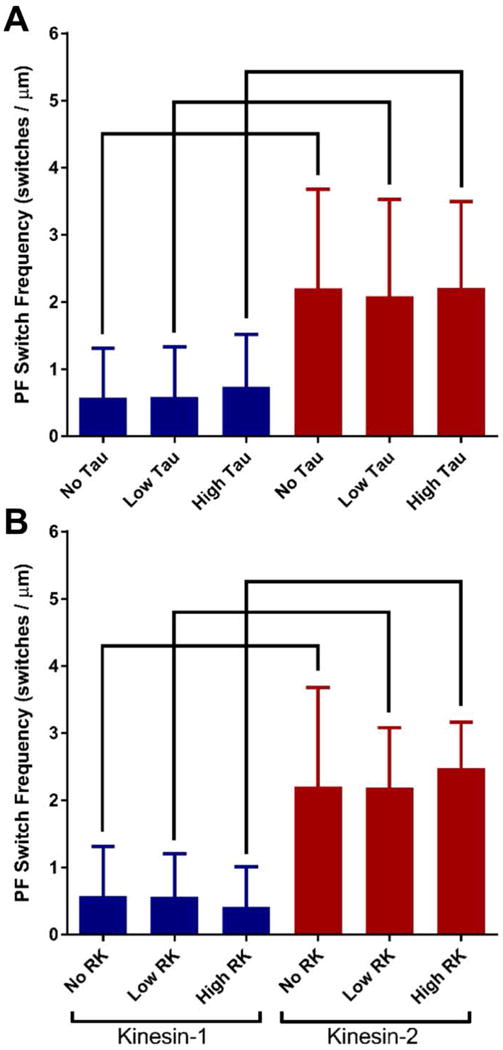
Kinesin-1 and kinesin-2 mean protofilament (PF) switching frequencies in the absence and presence of microtubule obstacles. Two concentrations of (A) Tau or (B) rigor kinesin (RK) obstacles are used. Kinesin-1 values are in blue and kinesin-2 values are in red. Error bars represent standard deviation and brackets represent significance between groups using a nonparametric ANOVA followed by a Dunn’s Multiple Comparisons Test (p-value < 0.05).