
Figure 3. YKL-1-116, a Cdk7-selective covalent inhibitor, synergizes with 5-FU or nutlin-3 to kill HCT116 cells.
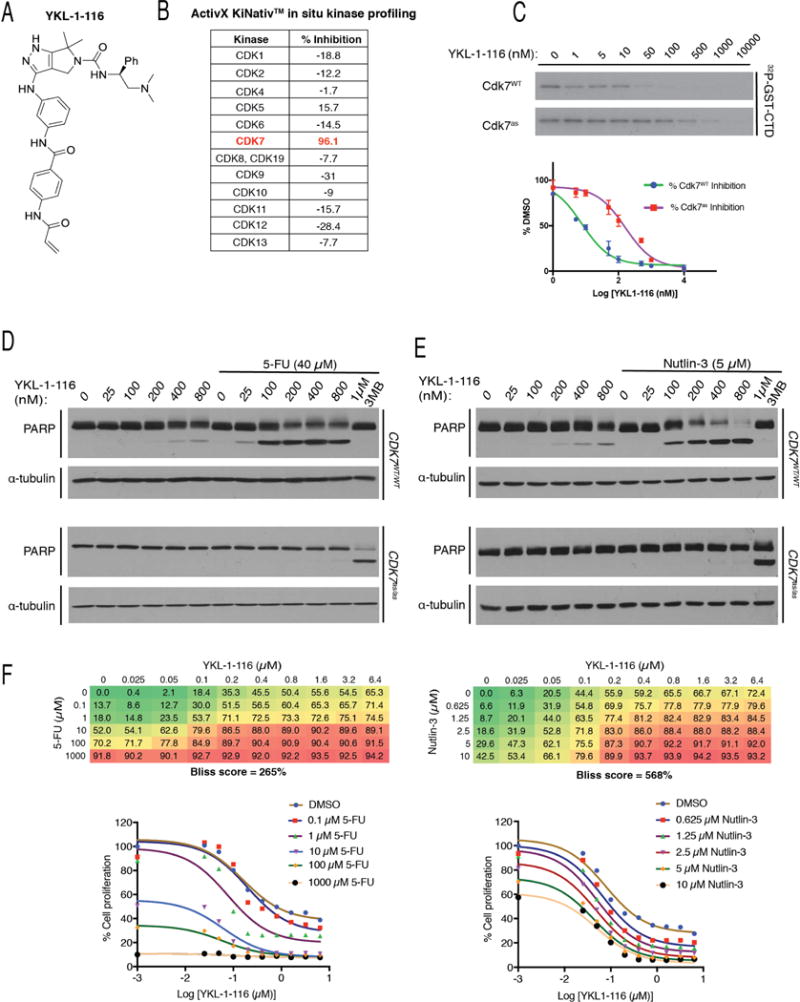
(A) YKL-1-116 structure.
(B) Selectivity of YKL-1-116 for Cdk7 over other CDKs, as determined by KiNativ™ kinome profiling. For each CDK, the percent inhibition of labeling by a desthiobiotin-ATP probe after exposure in vivo to YKL-1-116 is indicated.
(C) Inhibition of Cdk7 by YKL-1-116 in vitro. As in Figure 2A, complexes containing Cdk7 (WT or as) were incubated with indicated concentrations of YKL-1-116 and tested for kinase activity towards GST-CTD, with results shown by representative autoradiograms (top) and quantified by Phosphorimager (bottom). Error bars indicate ± S.E.M. of triplicate samples.
(D) CDK7WT/WT or CDK7as/as HCT116 cells were treated with indicated Cdk7 inhibitors, at indicated doses, with or without 40 μM 5-FU, as indicated, for 14 hr prior to lysis and immunoblot detection of PARP and α-tubulin.
(E) CDK7WT/WT or CDK7as/as HCT116 cells were treated with indicated Cdk7 inhibitors, at indicated doses, with or without 5 μM nutlin-3, as indicated, for 14 hr prior to lysis and immunoblot detection of PARP and α-tubulin.
(F) Bliss independence analysis in CDK7WT/WT cells for YKL-1-116 and 5-FU (left) or nutlin-3 (right). Bliss scores represent the mean of triplicate concentration matrices. Numbers in matrices indicate % reduction in metabolic activity as measured by resazurin staining, relative to DMSO-treated cells. Growth inhibition curves derived from these data are shown below each matrix.