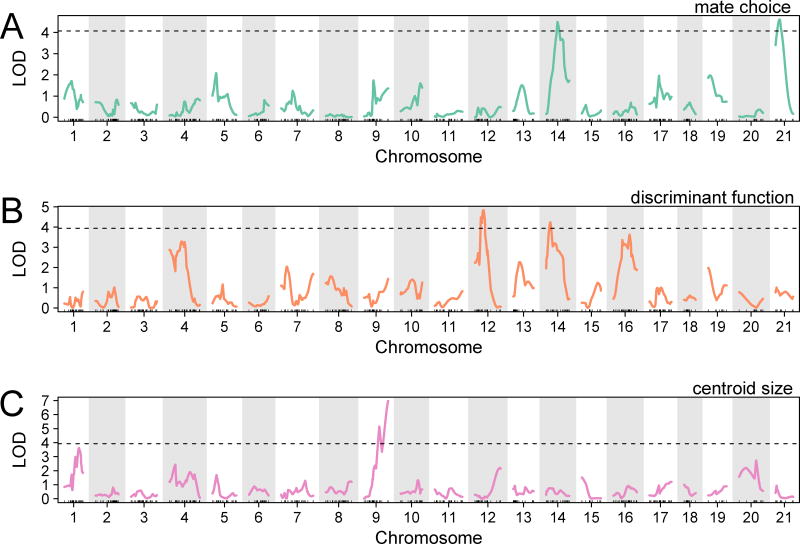
Figure 2. QTL mapping of female mate choice, body shape, and body size.
The graphs show LOD scores across the 21 stickleback chromosomes for: (A) female mate choice, (B) benthic-limnetic discriminant function, and (C) centroid size. Dotted lines: α=0.1 genome-wide significance cutoff based on 10,000 permutations. See also Table S2, Table S3, Table S4.

