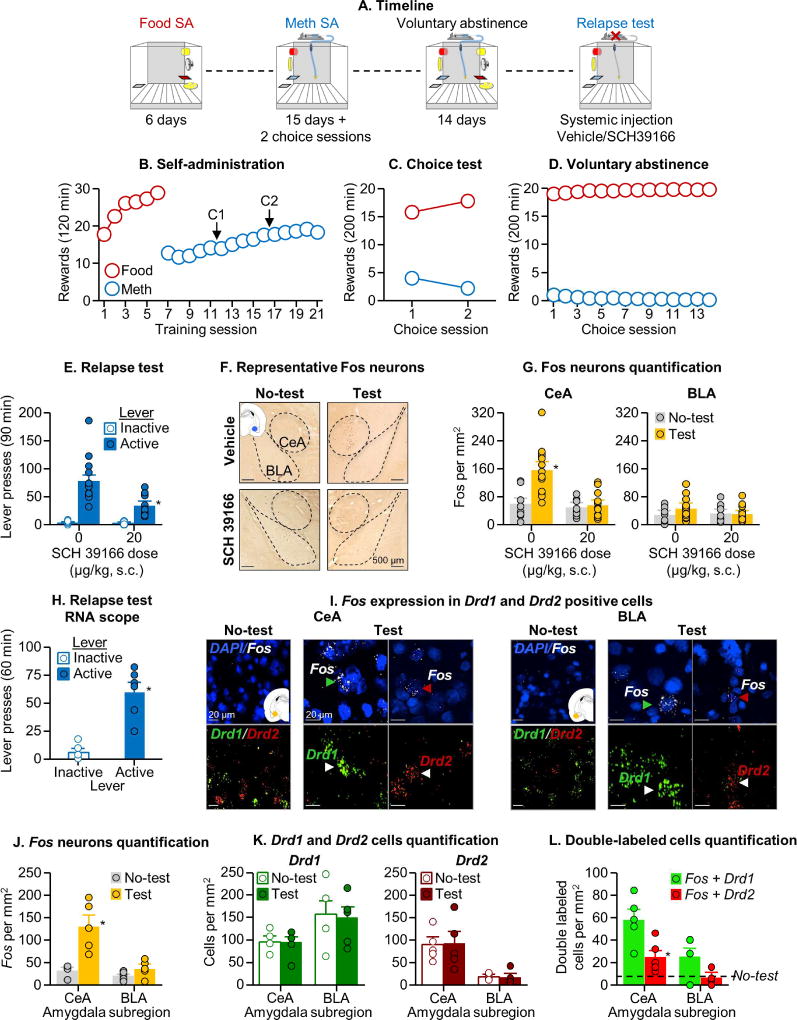
Figure 1. Systemic Drd1 antagonist injections decreased relapse after voluntary abstinence and relapse-induced activation of CeA.
(A) Timeline of the experiment. The operant chamber is equipped with two active levers (
 and
and
 ), one
 , two discriminative cues (
 for drug and
 for food), two conditioned stimuli (white light for drug and tone for food), a pump, and a food receptacle. (B) Self-administration training: Number of food rewards (5 palatable food pellets/reward delivery) or methamphetamine infusions (0.1 mg/kg/infusion) during the 120-min sessions (total n=54). (C) Discrete choice sessions during training: Food rewards and methamphetamine infusions earned during the 2 discrete choice sessions that were performed during training (20 trials every 10 min). (D) Voluntary abstinence: Number of food rewards and methamphetamine infusions earned during the 14 discrete choice sessions. (E) Relapse test: Lever presses on the active and inactive levers during the 90-min test session. During testing, active lever presses led to contingent presentations of the light cue previously paired with methamphetamine infusions during training, but not methamphetamine infusions (extinction conditions). We injected vehicle or SCH39166 (20 µg/kg, s.c) 30 min before testing (n=13–14 per group). The No-test group was kept undisturbed in their home cage (n=8 per group). * Different from the active lever in the vehicle condition, p<0.05 (F) Representative photomicrographs of Fos cells in central (CeA) and basolateral (BLA) amygdala. (G) Amygdala c-Fos expression: Number of Fos-IR nuclei per mm2 in the CeA and BLA. * Different from the No-test group, p<0.05 (H) Relapse test RNAscope: Lever presses on the active and inactive levers during the 60-min test sessions (n=5–6 per group). * Different from inactive lever, p<0.05 (I) Representative photomicrographs of CeA and BLA and Fos labelling in the Relapse test and No-test groups, and Drd1 or Drd2 labelling in the Relapse test group (Fos, white; Drd1,
 ; Drd2,
 ; DAPI,
 ). Arrows indicate representative cells. (J) Fos-IR neurons: Number of Fos-IR nuclei per mm2 in CeA and BLA. * Different from the No-test group, p<0.05 (K) Drd1 and Drd2 positive cells: Number of Drd1 and Drd2 cells in CeA and BLA. * Different from the No-test group, p<0.05 (L) Fos-IR co-expression with Drd1 or Drd2: Number of double-labeled neurons per mm2 in the CeA and BLA. * Different from Fos+Drd1, p<0.05. Data are mean±SEM. See also Figure S1 and S2.

