
Figure 3. Mizoribine selectively affects the viability of cells with activated mTORC1 through the depletion of guanylate nucleotides.
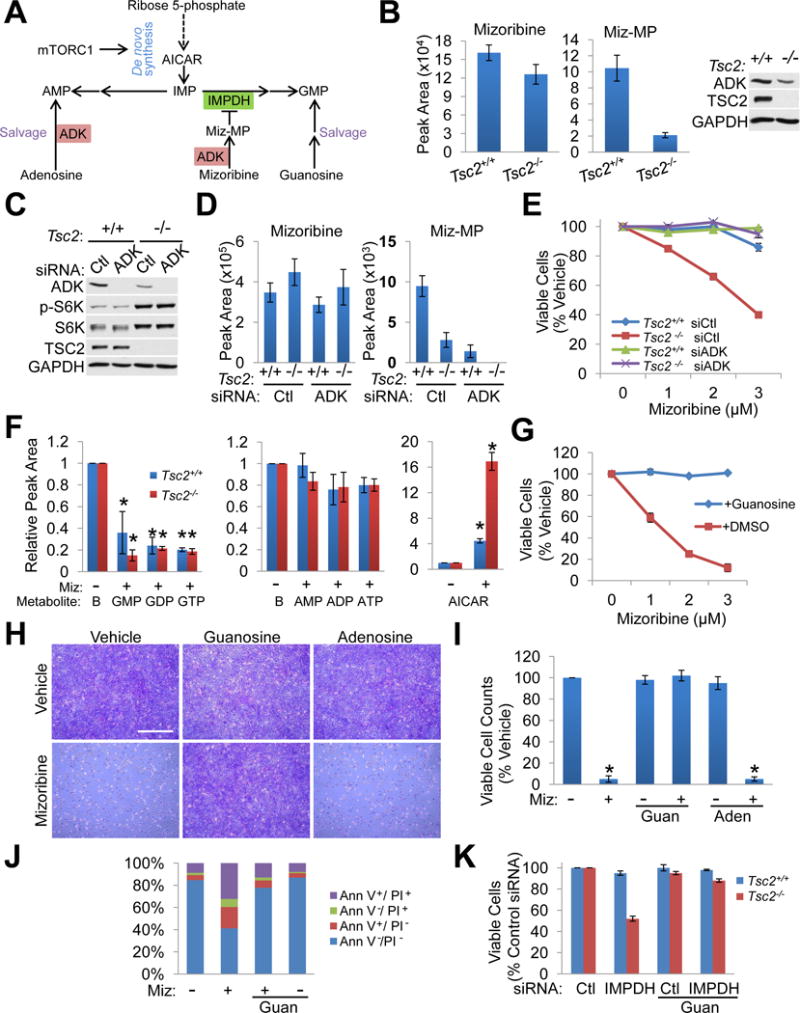
(A) Schematic of de novo purine synthesis and salvage pathways, and mizoribine conversion to mizoribine monophosphate (Miz-MP) by adenosine kinase (ADK).
(B) Intracellular mizoribine and Miz-MP levels measured by LC-MS/MS in Tsc2+/+ Trp53−/− and Tsc2−/− Trp53−/− MEFs treated with vehicle or mizoribine (2 μM, 18 hr). n=3 biological replicates. ADK levels were assessed by immunoblot (right).
(C) Tsc2+/+ Trp53−/− and Tsc2−/− Trp53−/− MEFs 48 hr post-transfection with control or ADK siRNAs were analyzed by immunoblotting.
(D) Conversion of mizoribine to Miz-MP in cell free extracts prepared from the cells in C. Mizoribine was added to extracts for 30 min, and mizoribine and Miz-MP levels were measured by LC-MS/MS. n=3 biological replicates
(E) Tsc2+/+ Trp53−/− and Tsc2−/− Trp53−/− MEFs were treated with mizoribine (48 hr). Cell viability is graphed as the percentage of vehicle-treated cells. n=6 biological replicates
(F) Relative abundance of the indicated metabolites, measured by LC-MS/MS and normalized to baseline, represented by left bars “B” (the abundance of each metabolite in vehicle-treated cells with values set to 1), from Tsc2+/+ Trp53−/− and Tsc2−/− Trp53−/− MEFs treated with vehicle or mizoribine (2 μM, 16 hr). n=3 biological replicates
(G) Viability of Tsc2−/− Trp53−/− MEFs treated for 72 hr with vehicle or mizoribine at the indicated concentrations with or without 50 μM guanosine and graphed as the percentage of vehicle-treated cells. n=6 biological replicates
(H,I) Tsc2−/− Trp53−/− MEFs treated with vehicle or mizoribine (3 μM, 72 hr) with or without 50 μM guanosine (guan) or 50 μM adenosine (aden), stained with crystal violet (H) or counted by trypan blue exclusion (I). Viable cell counts are graphed as the percentage of vehicle-treated cells (n=3 biological replicates). Scale bar = 1 mm
(J) Tsc2−/− Trp53−/− MEFs treated with vehicle or mizoribine (3 μM, 72 hr) and/or 50 μM guanosine. Cell death was quantified by Annexin V/PI staining and graphed as the percentage of the total cell population. n=3 biological replicates
(K) Viability of Tsc2+/+ Trp53−/− and Tsc2−/− Trp53−/− MEFs transfected with control (Ctl) or IMPDH1 and 2 siRNAs for 48 hr and cultured with or without 50 μM guanosine. Data are represented as the percentage of control siRNA-transfected cells. n=6 biological replicates
Graphical data are represented as mean of indicated replicates, error bars represent ± SEM.
*p<0.05 by two-tailed Student’s t test.
See also Figure S3.