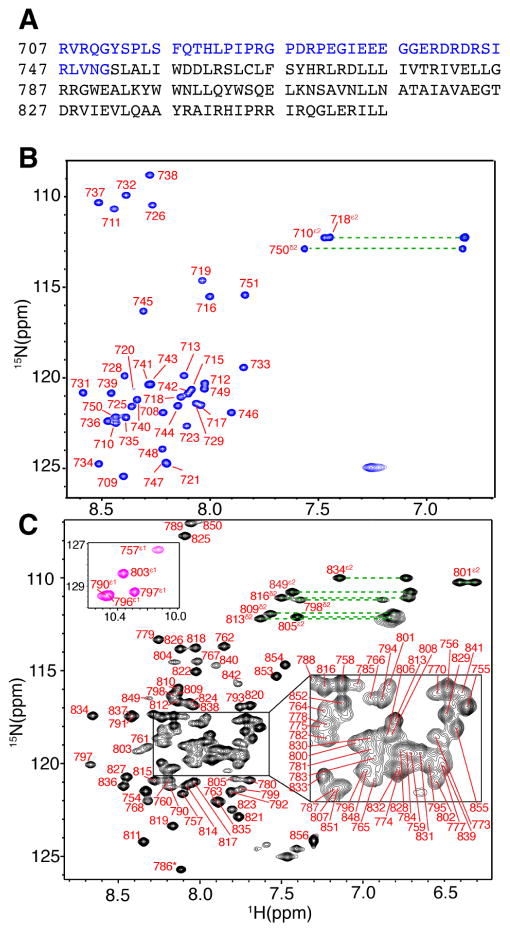
Figure 1. NMR Spectra of the Two Independent gp41CT Domains.
(A) Amino acid sequence of the HIV-1 gp41CT protein (pNL4-3 isolate). Sequences of gp41CTN and gp41CTC are highlighted in blue and black, respectively. (B) 2D 1H-15N HSQC spectrum obtained for gp41CTN (200 μM) at 32 °C. (C) 2D 1H-15N HSQC spectrum obtained for gp41CTC (300 μM) at 50 °C. Tryptophan side chain signals are colored in magenta (inset). Dashed lines indicate side chain amide signals.

