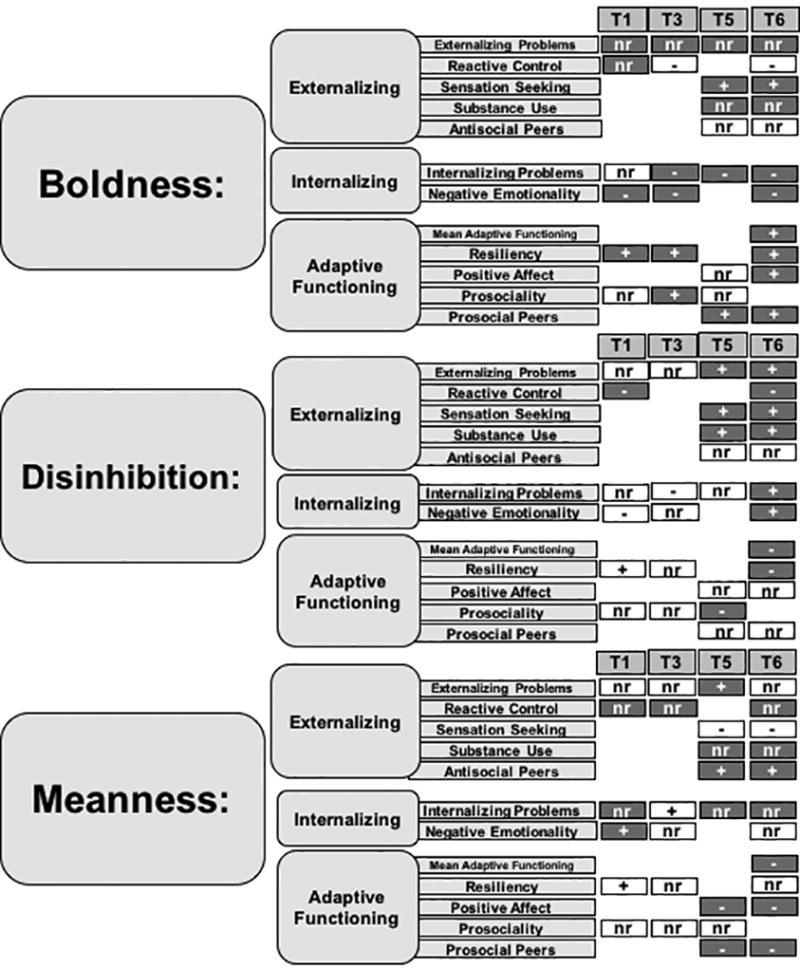
Figure 2. Resulting Prospective and Concurrent Nomological Networks of the TriPM Scales.

TriPM= The Triarchic Model of Psychopathy. T1= ages 3–5; T3 = ages 9–11; T5= ages 15–17; T6 = ages 18–20. + = positive association. − = negative association. nr = not related. The prospective (T1, T3, T5) and concurrent (T6) associations between each TriPM scale and all measured correlates found in the current study. Correlates are grouped by domain (e.g., externalizing, internalizing, adaptive functioning). When measures were assessed at a given time point, a box is displayed with either a +, − or nr to indicate that the relationship between that correlate at that time point was either positively, negatively, or not related to the TriPM scale to the left. White boxes explicitly indicate that the relationship was in contrast to the hypothesized direction.
