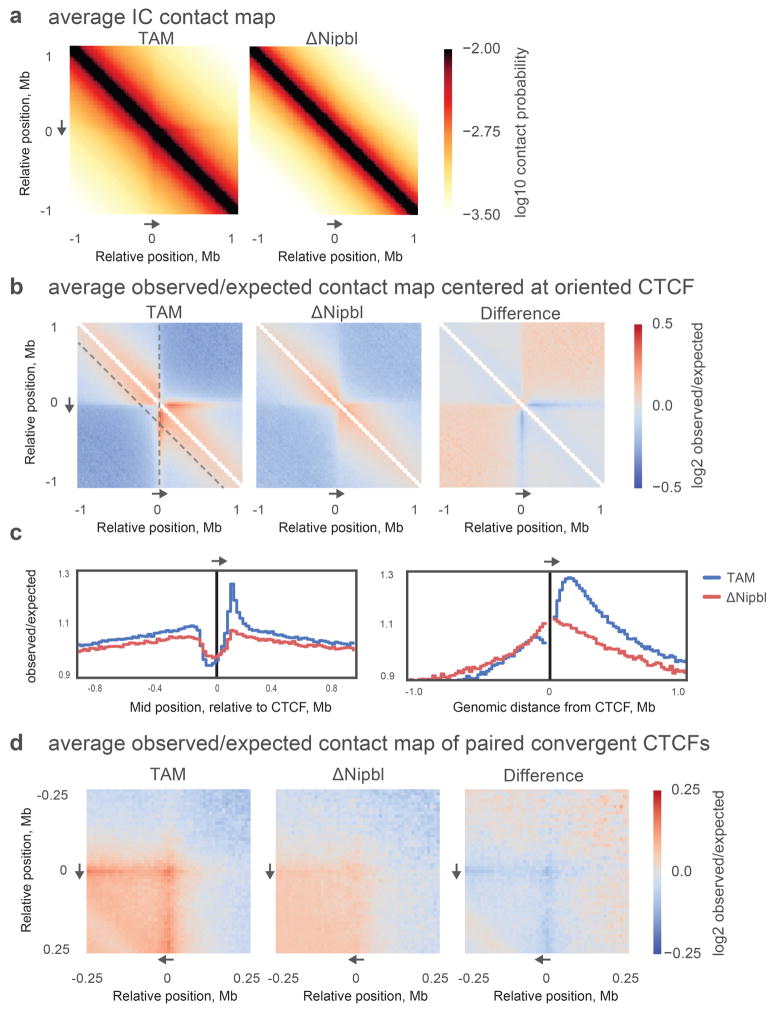
Extended Data Figure 6. The average Hi-C contact footprint of CTCF sites.
CTCF peaks were detected in our ChIP-Seq data from TAM control cells and supported by an underlying CTCF binding motif occurrence. (a) Average iteratively corrected 20kb-resolution contact map of around ~42,000 CTCF peaks in TAM and ΔNipbl cells. Individual contributing snippets to the composite heatmap were oriented such that the CTCF motif points in the direction shown by the grey arrow. (b) Average 20kb-resolution contact map normalized by the expected contact frequency at a given genomic separation. (c) Average observed over expected contact frequency curves along “slices” of the composite heatmaps depicted by dashed grey lines in (b): left panel – the insulation profile at 200kb separation (diagonal dashed line on (b)), right panel – the “virtual 4C” curve (vertical dashed line on (b)) of the composite heatmap. (d) Average 10kb-resolution observed over expected contact map centered on ~11,000 pairs of CTCF ChIP-seq peaks with convergent motif orientations separated by 200 +/− 10kb.

