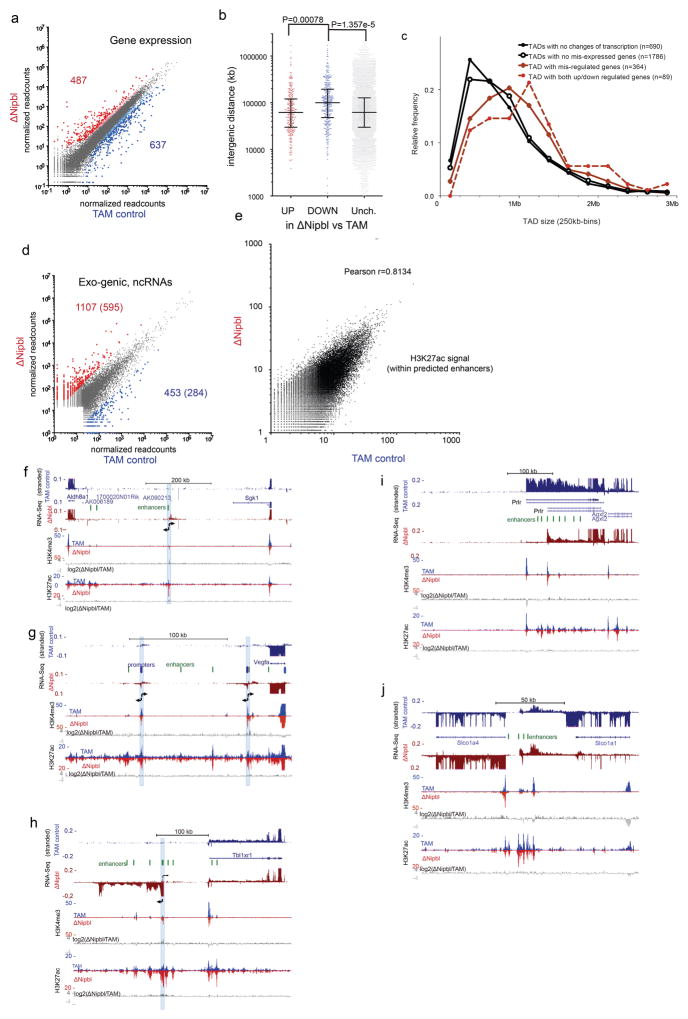
Extended Data Figure 10. Expression changes in ΔNipbl hepatocytes.
(a) Changes in gene expression between TAM controls and ΔNipbl liver cells (four replicates for each condition) analyzed with DESeq2 59. Genes with significant changes in gene expression (FDR > 0.05) are colored in red (up-regulated, n=487) or blue (down-regulated, n=637), with larger dots corresponding to gene with a fold-change > 3. (b) Intergenic distances for the different categories of disregulated genes (with fold-change >3; up-regulated=268; down-regulated=350; unchanged=15055). Statistical differences determined by an unpaired two-tailed t-test. The differences between means were 50020.40 (CI 95% = 27723.85–72316.95) and 52185 (CI 95%=21824–82547) for comparison between down-regulated vs unchanged, and down-regulated vs up-regulated, respectively (c) Size distribution of the TADs observed in WT (lost in ΔNipbl) depending on the degree alteration of their transcriptional states. The size of TAD with transcriptional changes (red) is significantly larger than those that do not show transcriptional alterations (black) (Kolmogorov-Smirnov, P=4.095e-08) (d) Change in transcription in non-genic intervals (including inter-genic and antisense within gene bodies). Gene expression was calculated as the normalized number of read within intervals defined by merging adjacent 1kb windows showing readcounts over background (see Methods). The numbers of non-coding transcription up-regulated (in red) or down-regulated (in blue) in ΔNipbl compared to the TAM control is given (P-value <0.01 using a two-tailed t-test, four replicates per condition, fold-change higher than 8), with the second number indicating the high-confidence events (labelled with coloured dots, expression value over an arbitrary threshold of 30 reads) which constitute the list used for subsequent analyses. (e) Comparison of control and ΔNipbl H3K27ac normalized signals within predicted liver enhancer elements (n=51850; readcounts within +/− 500bp of predicted enhancer peak) 66. (f–i) Examples of transcriptional changes upon Nipbl deletion. Stranded RNA-Seq and ChIP-Seq tracks (H3K4me3, H3K27ac) are shown for control (blue) and ΔNipbl (red) samples. Comparison of the chromatin profiles are shown with log2(ΔNipbl/TAM) tracks for H3K4me3 and H3K27ac (in grey). Active enhancers (peaks of high H3K27ac, H3K4me1 66, low H3K4me3) are depicted as green ovals. (f) chr10:21,090,000–21,781,000. Bidirectional transcription (position labeled with a blue bar) arises from an isolated enhancer in ΔNipbl cells. (g) chr17:45,945,000–46,176000. Bidirectional transcription (position labeled with a blue bar) arises from two cryptic promoters (H3K4me3 peaks, no/weak transcription in TAM) downstream of Vegfa. (h) chr3:21,712,500–22,126,240. A new transcript from a cryptic promoter 100 kb upstream of Tbl1xr1. H3K27ac signal is enhanced at peaks surrounding the activated cryptic promoter. (i) chr15:9,873,000–10,354,700. Promoter switch for Prlr, from an upstream promoter to a more downstream one surrounded by active enhancers. (j) chr6:141,743,961–141,904,692. Downregulation of Slco1a1 and concomitant up-regulation of Slco1a4 and non-coding intergenic transcripts (arrowheads). Distance of Slco1a4 promoter to intergenic enhancers is less than 10kb, compared to 80 kb for Slco1a1.

