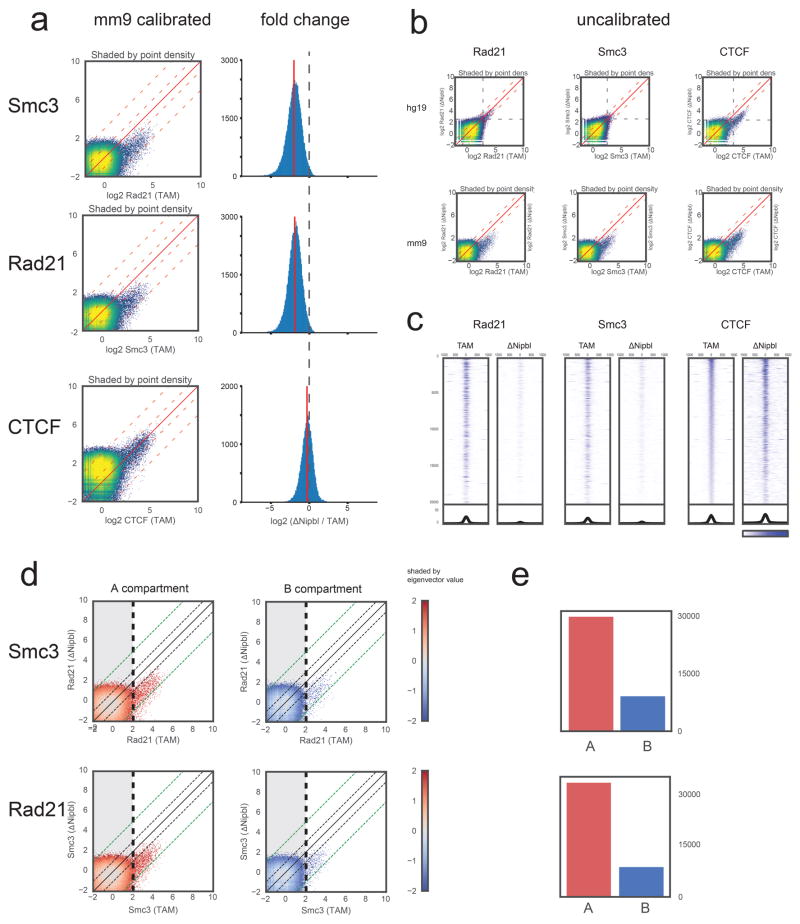
Extended Data Figure 3. Calibrated ChIP-seq for CTCF and cohesin (Rad21 and Smc3).
(a) Left: Comparison of calibrated mouse ChIP-seq data. For each factor (CTCF, Rad21, Smc3), we used the ratio of the top 0.2% of 200bp bins (~29,000 points) in the TAM hg19 fraction vs the ΔNipbl hg19 fraction to rescale the mm9 signal in the ΔNipbl condition in order to be compared with the mm9 signal in the TAM condition (see Methods). The scatter plot heatmaps in the left column are shaded by point density. Right: Log2 fold difference ratio between ΔNipbl and TAM for ChIP-seq peaks (points in with ChIP in TAM>2.0). While the calibrated CTCF binding signal stays relatively constant between conditions (within the 2-fold envelope), most of the calibrated cohesin binding signal drops by ~2–8 fold in ΔNipbl, with a mean depletion rate of 3.7 fold. (b) Uncalibrated ChIP-seq reads used for the calibration human cell (hg19, left) and mouse (mm9, right). Processed mapped reads were converted to genome-wide signal tracks binned at 200bp resolution. Scatter plots of these genomic tracks (TAM vs ΔNipbl) are shown as heatmaps shaded by point density. For cohesin subunits, the hg19 signal has a similar profile in both conditions, but the ΔNipbl signal is diminished in the uncalibrated mm9 fraction. The uncalibrated mm9 signal appears to go down in ΔNipbl for CTCF as well; however, a similar diminishing effect is seen in the hg19 data. (c) Stacked heatmaps of calibrated ChIP-seq signal at the top 20,000 CTCF binding sites (peaks with an assigned CTCF motif), ranked by fold change over input in the TAM control condition. (d) Scatter plots of calibrated ChIP-seq tracks as in (b), but split into two groups by compartment type A (compartment eigenvector>0) and B (eigenvector assignment < 0). The shading is colored by the eigenvector signal. Black and green dashed diagonal lines demarcate the 2-fold and 8-fold envelopes, respectively. (e) Total cohesin occupancy. Bar plot showing the number of ChIP-seq 200bp points in the non-shaded area of the scatter plots (bins with TAM signal > 2) representing high confidence binding signal in WT. While cohesin binding is more than 3-fold more prevalent in A-compartment regions, the scatter plots show that both A and B regions respond equally to Nipbl deletion.

