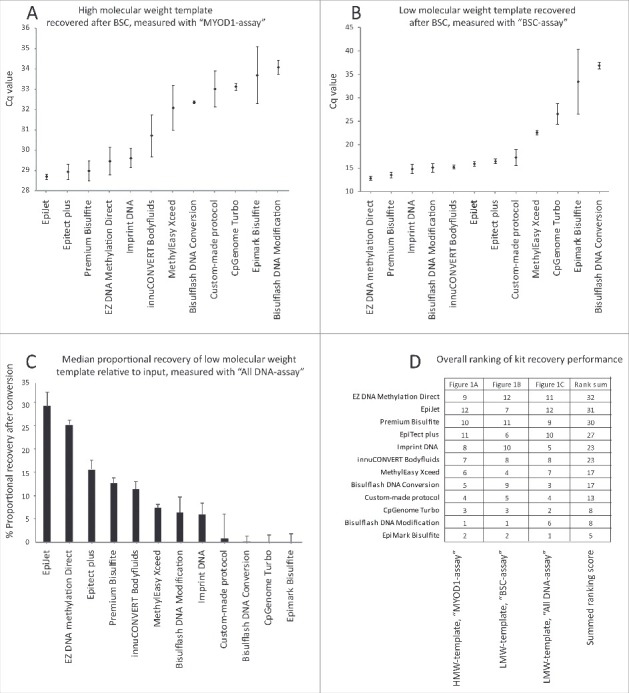
Figure 1.

Impact of DNA molecular weight and fragment size on recovery after BSC. (A) Median HMW-DNA template quantity recovered after BSC assessed using the “MYOD1-assay” qPCR. Median Cq values of all technical replicates for 100 ng of input are shown. Whiskers represent median absolute deviation (MAD). (B) Median LMW-DNA template quantity recovered after BSC assessed by “BSC-assay” qPCR, Cq values of all technical replicates for 1 ng input are presented. Whiskers represent MAD. Please note that 1 ng input is below the recommended threshold for the Bisulflash DNA Conversion and Epimark kits. (C) Median proportional recovery of all replicates after BSC, analyzed by “All DNA-assay” for 1 ng input of LMW-DNA template (as percentage of input). Whiskers represent MAD. Bisulflash DNA Conversion and Bisulflash DNA Modification were only performed in 2 replicates. All other kits performed in 3 BSC replicates. (D) Recovery ranks for each kit and all 3 templates: HMW-DNA by “MYOD1-assay” (A); LMW-DNA by “BSC-assay” (B); and LMW-DNA by “All DNA-assay” (C). A score from 1–12 was given to each kit after each experiment, where ‘12’ corresponds to the kit with the lowest Cq value, i.e., the highest recovery, and ‘1’ corresponds to the kit with the highest Cq value, i.e., the lowest recovery. The 3 scores for each kit were added in to generate a final rank list. This rank was the basis for the selection of kits for further analyses.
