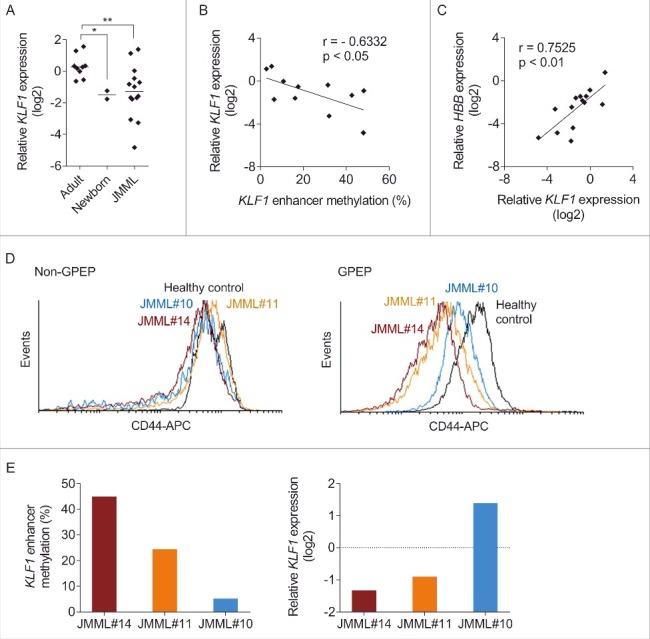
Figure 5.

Expression analysis of KLF1 and its regulatory target CD44. (A) KLF1 transcript levels relative to the GAPDH reference gene measured by reverse transcriptase quantitative polymerase chain reaction in GPEP cells of adults, newborns, and patients with JMML. Cells of a healthy adult were used as calibrator (relative log2 expression = 0). Mann-Whitney test: *P ≤ 0.05; **P ≤ 0.01. (B) Correlation between KLF1 enhancer methylation and KLF1 mRNA expression in GPEP cells of patients with JMML. r, Pearson coefficient. (C) Correlation between KLF1 and HBB mRNA expression in GPEP cells of patients with JMML. r, Pearson coefficient. (D) Surface expression of CD44 on glycophorin A-negative mononuclear (non-GPEP) cells (left panel) or GPEP cells (right panel) of 3 JMML patients and a healthy control measured by flow cytometry. APC, allophycocyanin. (E) KLF1 enhancer methylation (left panel) and KLF1 mRNA expression relative to GAPDH (right panel) in GPEP cells of 3 JMML patients analyzed in.Fig. 2D Cells of a healthy control were used as calibrator (dashed line).
