
Figure 2.
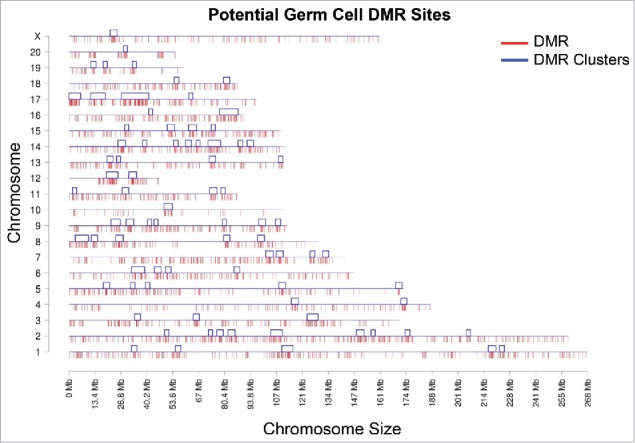
Genome-wide prediction of potential epimutation sites based on promoter only DMR training sets. Chromosomal plot of germ cell data set sperm shows the predicted 3+ sites and the clusters of DMR regions. Red lines below each chromosome line indicate predicted potential DMR sites (3,233) when sperm is used as the training set; blue boxes above each line indicate clusters.80 Y-axis shows each of the 21 chromosomes while X-axis shows the length of the chromosome with predicted potential DMR locations and the clusters. Clusters are regions that indicate over-representations of sites within a small sub-section of the genome.55 Modified from.4