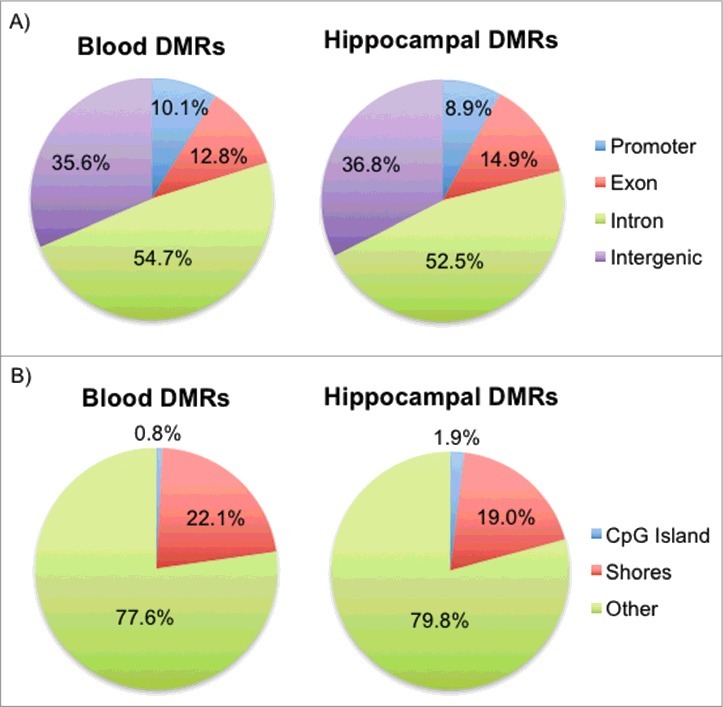
Figure 2.

Genomic locations of the blood and hippocampal DMRs with respect to genes and CpG islands. (A) Pie charts for both blood and hippocampal DMRs show the percentage of DMRs that fall in promoters, exons, introns, and intergenic regions. (B) Pie charts for both blood and hippocampal DMRs show the percentage of DMRs that fall in CpG islands, shores, and non-CpG-associated regions (Other).
