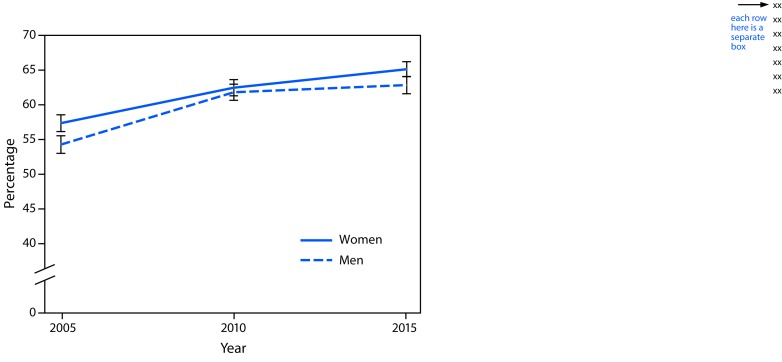
FIGURE.
Percentage* of U.S. women† and men§ aged ≥18 years who reported recent walking for transportation or leisure — National Health Interview Survey, 2005–2015
* Weighted percentages, age-standardized to the 2000 U.S. standard population. Error bars represent upper and lower bounds of 95% confidence intervals.
† Significant linear trend from 2005 to 2015 only (p<0.05), based on trend analyses using logistic regression controlling for age category.
§ Significant linear trend from 2005 to 2015 (p<0.05) and a significant deviation from linear trend (p<0.05), based on trend analyses using logistic regression controlling for age category.

