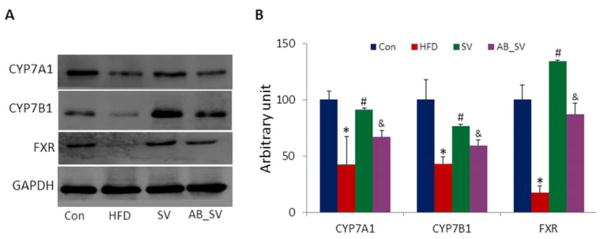
Figure 6.
Expression of hepatic proteins with western blot. A: The representative bands of hepatic CYP7A1, CYP7B1 and FXR proteins detected with western blot (n=4). B: The statistical results of protein expression. Data are means±S.E.M. *indicates P<0.05 compared to Control group, #P<0.05 compared to HFD group, &P<0.05 compared to SV group with two-tailed Student’s t test.

