
Fig. 1.
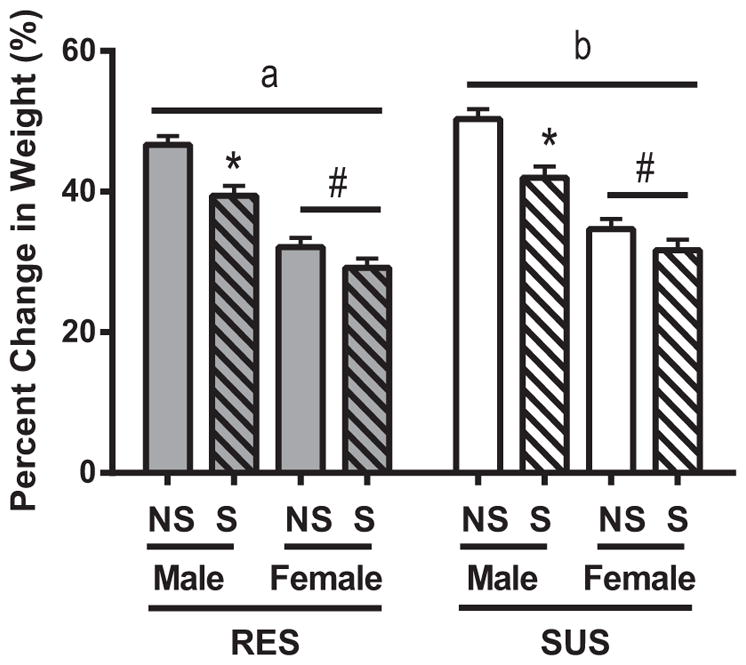
Body mass. Bars represent percent change in body mass over the duration of the study for rats resistant to showing reduced activity in the forced swim test after stress (RES) and rats susceptible to showing reduced activity in the forced swim test after stress (SUS). Body mass was tracked for both rats that were not exposed to stress (NS) and those exposed to chronic mixed modality stress (S) through adolescence. Data are presented as mean ± SEM. Statistics: significant line differences (p < 0.05) are indicated by letters (i.e., “a” and “b”), with different letters indicating significant differences. Also, #p < 0.05 compared to males of same line, and *p < 0.05 as compared to NS of same line.