
Fig. 2.
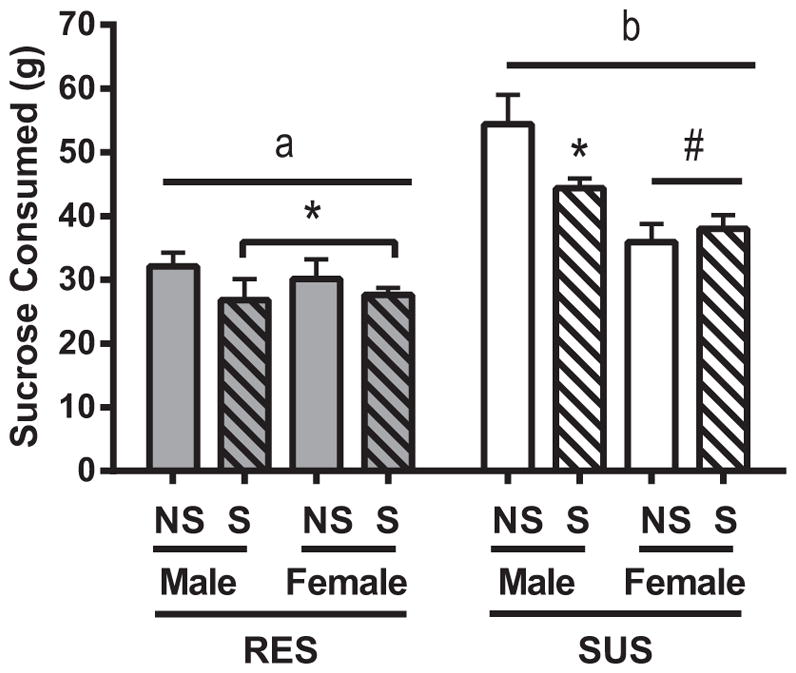
Sucrose intake. Sucrose and water intake for RES and SUS rats for both non-stressed (NS) and stressed (S) animals. Total sucrose solution consumed on the second day of testing is shown. Data are presented as mean ± SEM. Statistics: significant line differences (p < 0.05) are indicated by letters, with different letters indicating significant differences. Also, #p < 0.05 compared to males of same line, and *p < 0.05 as compared to NS of same line.