
Figure 1.
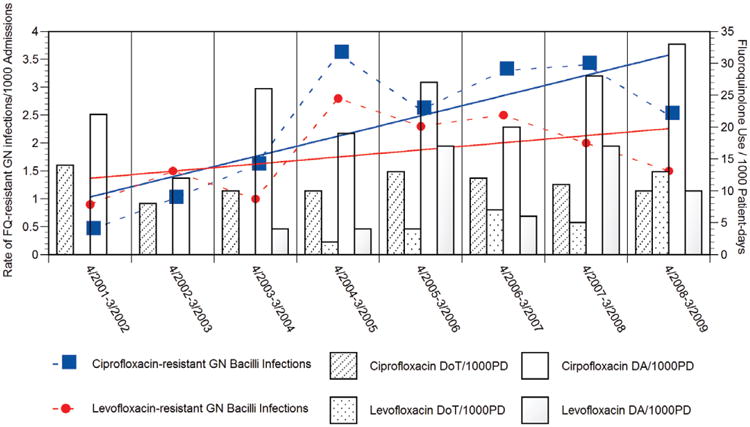
Trends in ciprofloxacin-resistant (blue squares) and levofloxacin-resistant (red dots) Gram-negative bacilli infections among hospitalized children per 1000 admissions, and ciprofloxacin and levofloxacin use expressed as doses administered and days of therapy per 1000 patient-days, Alfred I. duPont Hospital for Children 2001–2009. Sloping of ciprofloxacin resistance (blue line) and levofloxacin resistance (red line) overtime are shown