
Figure 5. MicroRNA expression subtypes.
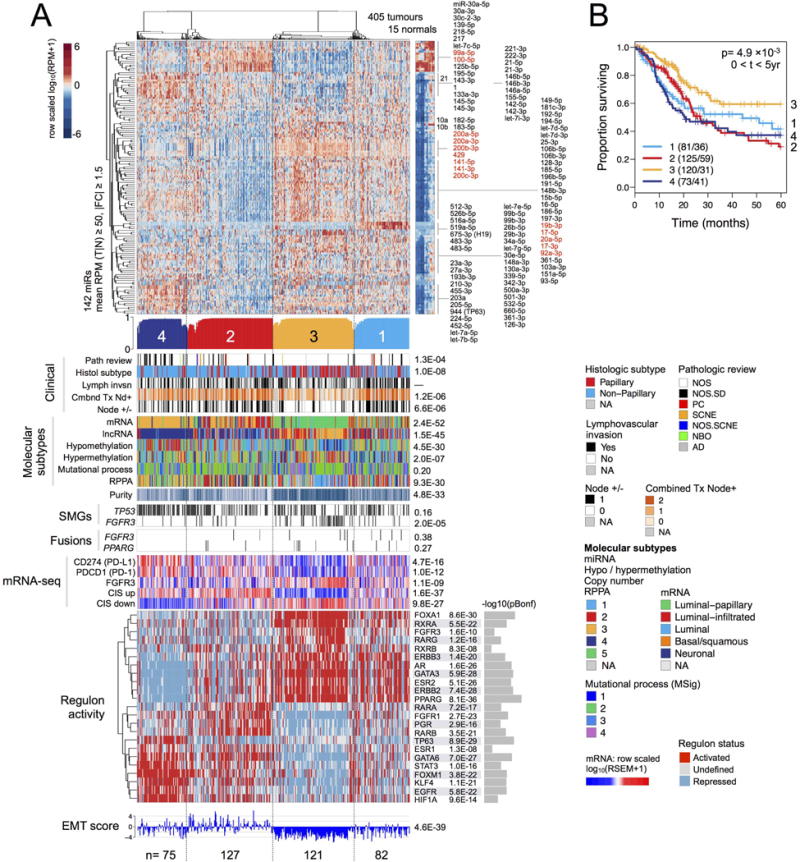
(A) Heatmap and covariates for a 4-cluster unsupervised consensus clustering solution. Top to bottom: Normalized heatmap showing a subset of 142 miRNAs that had a mean RPM ≥ 50 and an absolute value of tumour-vs-normal fold change ≥ 1.5. Profile of silhouette width calculated from the consensus membership heatmap, Wcm, with lower values indicating samples that are atypical cluster members. Covariate tracks for clinical parameters, genomic platform subtypes, purity, mutations in TP53 and FGFR3, and FGFR3 and PPARG gene fusions. Row-scaled regulon activity profiles for 23 regulators that have been associated with bladder cancer. Row-scaled mRNA levels for 12 genes, then for collapsed CIS gene sets (Dyrskjot et al., 2004) (Methods; CIS up = genes up-regulated in CIS; CIS down = genes down-regulated in CIS); and RNA-seq-based EMT scores (Mak et al., 2016). The following p values are Bonferroni-corrected: for mutated genes (for 58 SMGs), gene fusions (for 23 fusions), regulon activity (for 23 regulators), and mRNA-seq (12 genes).
(B) A Kaplan-Meier plot for overall survival data that has been censored at 5 years.