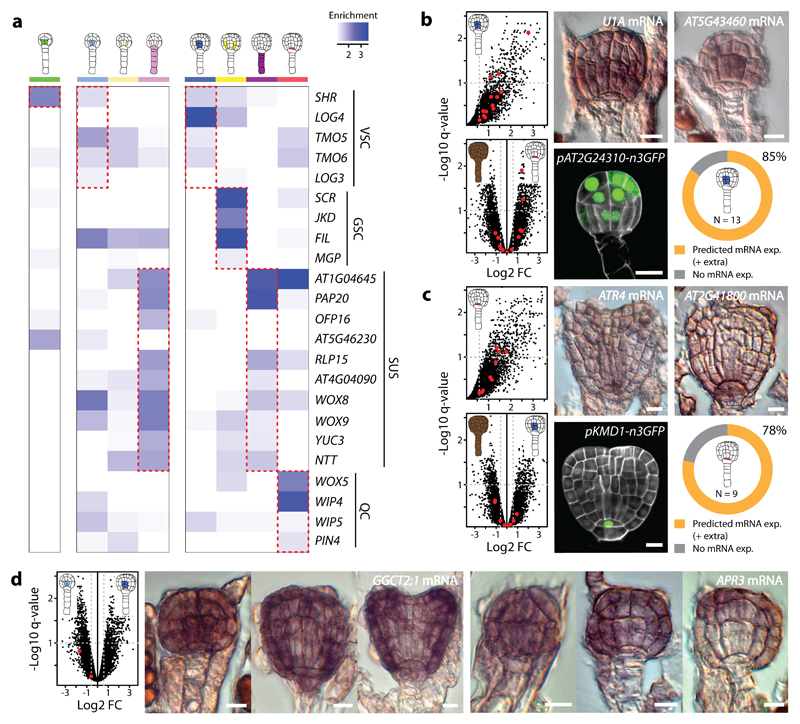
Figure 4. Expression patterns of selected genes validate atlas transcriptomic profiles.
(a) Heat map show enrichment (fold change; FC) of genes with known expression pattern in the embryo in all cell-specific samples when compared to corresponding nEMB stages, regardless of overall expression values. Enrichment is in blue (>1). The enrichment correlate well with published expression data for a majority of the genes, however, TMO6, LOG3, MGP, AT5G46230, WIP5 and PIN4 show enrichment below FC 1.5 in the expected cell type. Abbreviations: VSC = vascular tissue precursors, GSC = ground tissue precursors, QC = quiescent centre precursor, SUS = suspensor. (b-d) Scatter plots (left upper panel [b,c], left panel [d]) and mRNA (RNA in situ hybridization) and promoter-n3GFP expression of genes enriched in nVSC (b) and nQC (c) when compared to nEMB at late globular stage, and in early compared to late globular nVSC (d). Red dots mark the genes selected for gene expression analysis (here and Supplementary Fig. 5). Volcano plots in b and c (lower left panel) show enrichment of the selected nVSC and nQC genes in nQC (b) and nVSC (c), respectively. Log2 fold FC is plotted against the negative log10 q-value, where vertical dotted line = FC 1.5 and horizontal dotted line = q-value 0.1. Doughnut graphs in b and c (lower right panel) summarizes mRNA expression patterns of all spatially enriched genes. In total, 11 of 13 (85%) nVSC genes and 7 of 9 (78%) nQC genes showed expression in the correct cell type while the rest showed no expression. Plus (+) extra denotes broader expression pattern than exclusively in the predicted cell type. For both temporally nVSC enriched genes (d), expression gradually disappeared from the vascular tissue precursors after the early globular stage. Scale bar represent 10 μm in all panels. Representations are described in Table 1.

