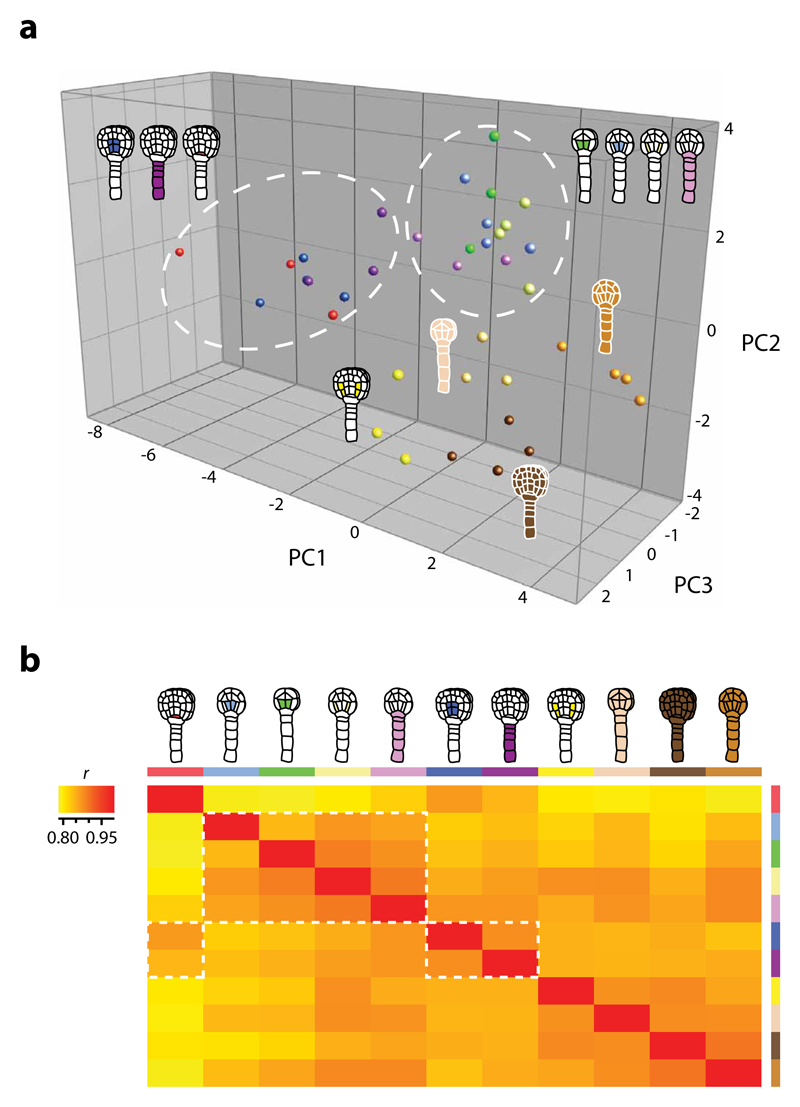
Figure 5. Expression diversity is cell type- and stage-specific.
(a) PCA comparing the top 2000 variable genes of the atlas, selected based on the interquartile range of all samples. The PCA distinguish spatial and (more distinct) temporal patterns where the cell-specific transcriptomes (except late globular nGSC) cluster separately from nEMB and according to developmental stage (white circles). Principal components 1 through 3 collectively represent 34.5% of the total variance in the dataset. Log2 normalised values were used. (b) Heat map of Pearson′s correlation coefficients (r) in pairwise comparisons of the whole atlas dataset where low correlation is in yellow and high correlation in red. Samples are assorted according to amount of correlation (low to high: left to right, top to bottom), which show a pattern that reflect the PCA results (white rectangles). Representations are described in Table 1.

