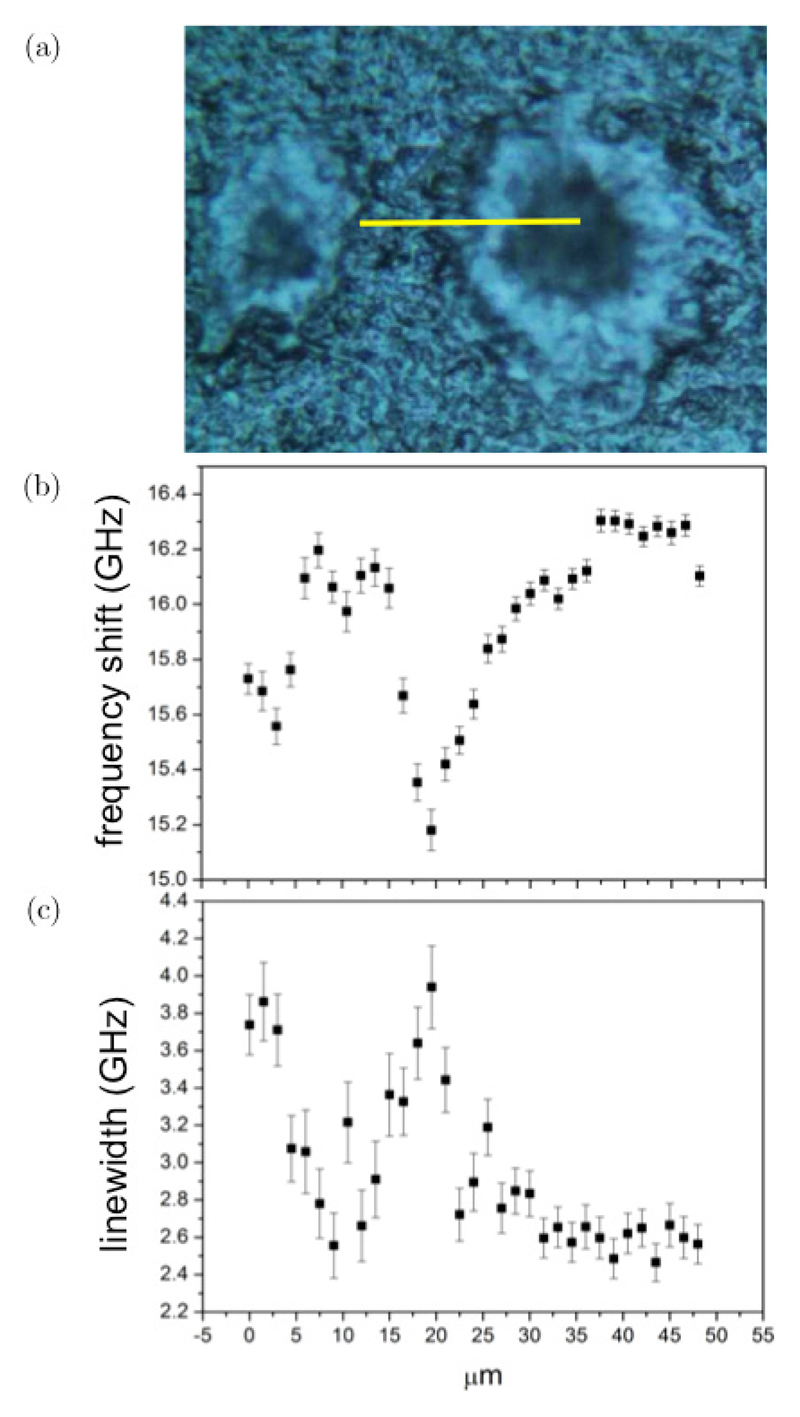
Fig. 4.
(Color online) Photomicrograph and results of fit analysis applied to Brillouin spectra of a TASTPM mouse brain hippocampal section. (a) Photomicrograph obtained using a Renishaw inVia Raman microscope with 20× objective. (Yellow line denotes a 50 μm long region, where Brillouin spectra were acquired through line scanning using a 1.5 μm step-size.) Plots of the (b) frequency shift and (c) linewidth of the Brillouin peak derived from fit analysis of the spectra in the linear scan; error bars indicate the standard error (square root of number of counts).

