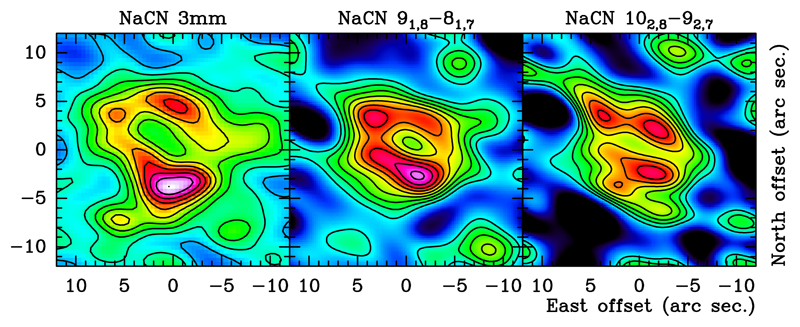
Fig. 1.
Comparison of the central channel of the low spatial resolution 3mm stacked map with maps of the ALMA Cycle 4 observations at 2 mm. The lowest contour corresponds to 10% of the peak flux, and the rest of contours are equally spaced in jumps of 10% with respect to the first contour. For absolute intensities see Figs.A.1,A.4, and A.5.

