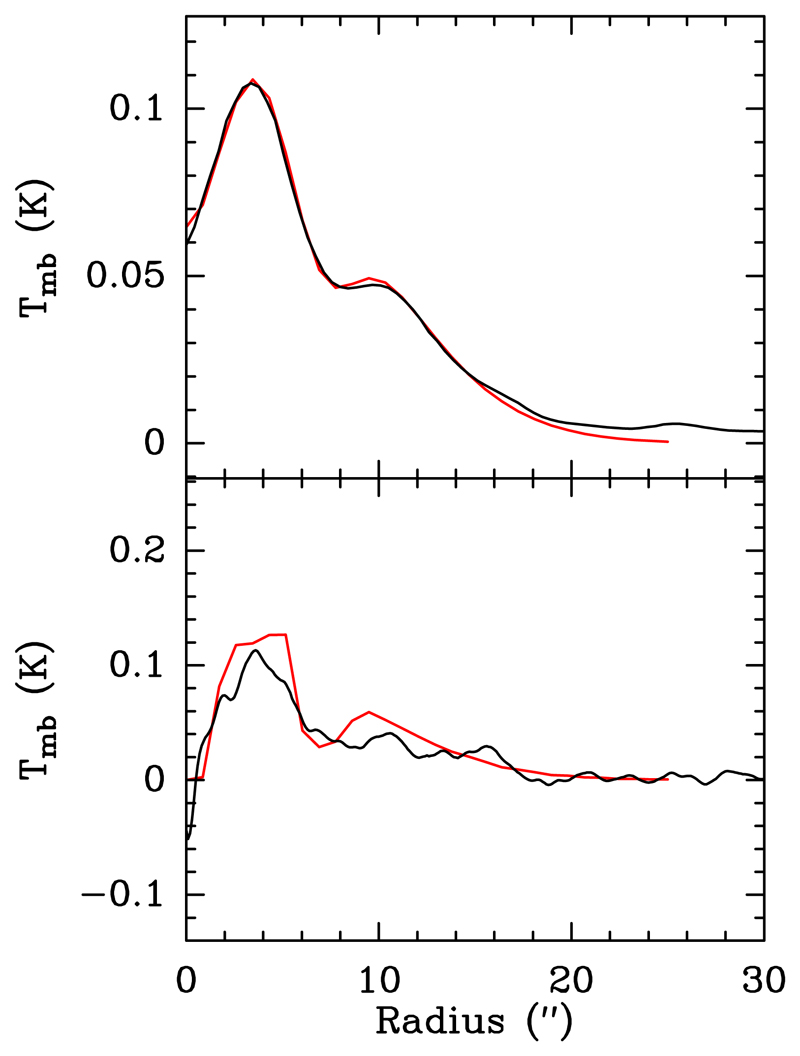
Fig. 3.
Top: Model fitting (red line) of the azimuthally averaged emission of the stacked NaCN lines presented in Table 1 for the low spatial resolution maps (Fig. A.1). Bottom: Model fitting (red line) of the azimuthally averaged emission of the stacked NaCN lines presented in Table 1 for the high spatial resolution maps (Fig. A.2).

