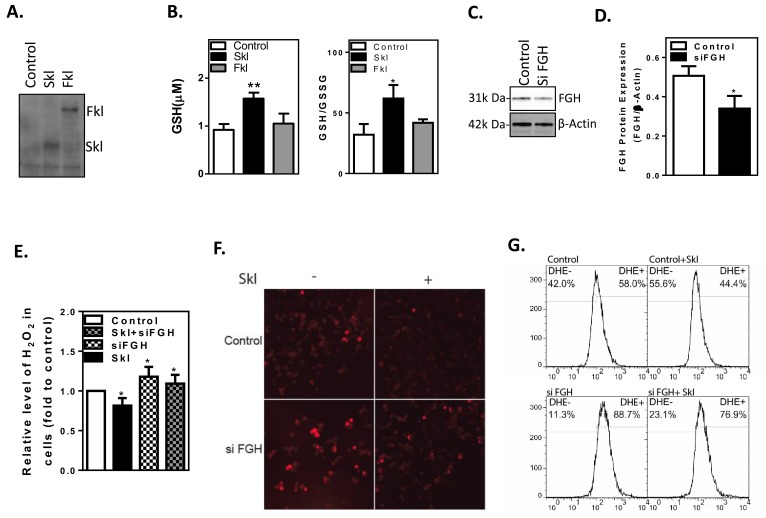
Figure 6. Skl regulates cellular anti-oxidant capacity.
A., Western blot analysis of full-length Klotho (Fkl) and short-form Klotho (Skl) proteins in HEK293 cells. B., Intracellular GSH levels and the GSH/GSSG ratio were increased by Skl. (*p < 0.05 vs. control). C., Western blot analysis of FGH protein expression. D., Quantitative analysis of FGH protein expression. (*p < 0.05 vs. control). E., H2O2 released by the cells was measured by Amplex Red reagent. (*p < 0.05 vs. control). F., DHE staining of the O2- level. G., Flow cytometry analysis of DHE-positive cells. Skl reduced the O2- level (upper panel). Knockdown of FGH raised the O2- level, regardless of Skl expression (lower panel). Bars, means ± SEM.

