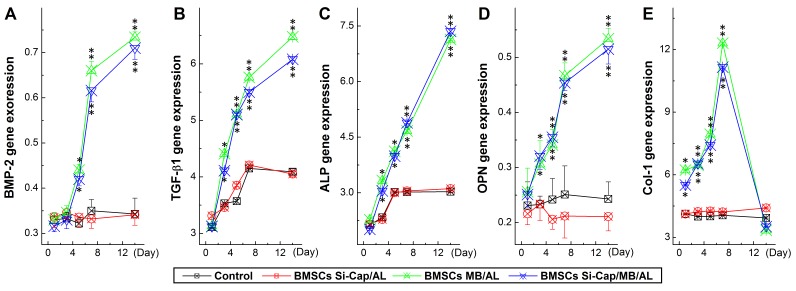
Figure 7. Expression profiles of growth factors (BMP2 and TGF-b) and related genes (ALP, OPN, and Col-I) using real-time RT-PCR.
The PCR data were collected from each tested group at different time points during co-culture and averaged data were expressed as mean ± SD, and n = 6. *P < 0.05 and **P < 0.01 vs BMSCs alone. A. BMP-2 expression profiles; B. TGF-1 expression profiles; C. ALP expression profiles; D. OPN expression profiles; E. Col-I expression profiles.

