
Figure 7. Effect of TgESAs on the activation of NF-kB, detected by Western blotting.
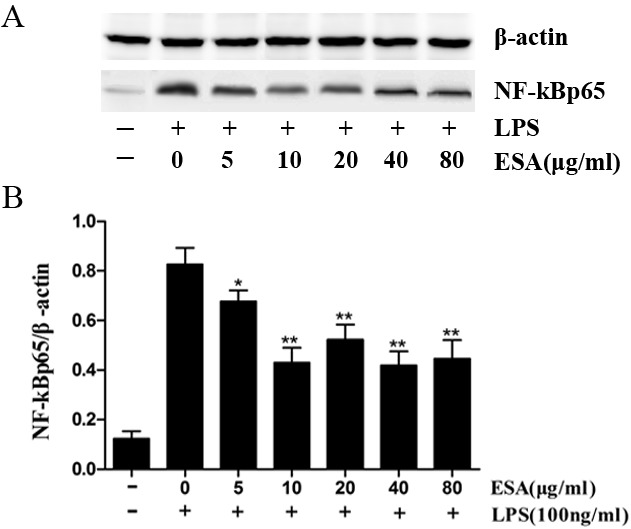
(A) The nuclear NF-kB protein expression of Ana-1 macrophage cells that were treated with 0, 5, 10, 20, 40 or 80 μg/ml ESAs from T. gondii for 48 h before LPS stimulation at 100 ng/ml for 1 h. (B) The results were analyzed by Quantity One software and stated in NF-kB vs β-actin. Values are mean ± standard deviation of three independent experiments. *P < 0.05 and **P < 0.01 compared with control group (0 μg/ml TgESAs plus LPS).