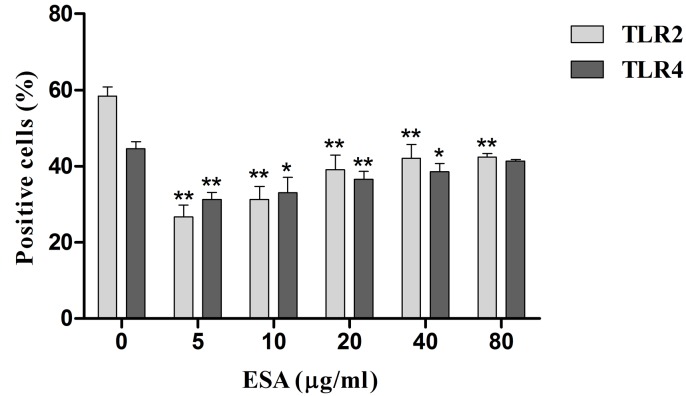
Figure 8. TLR2 and TLR4 expression in Ana-1 cells by flow cytometry.
Ana-1 cells were treated for 48 h with different concentrations (0, 5, 10, 20, 40, 80 μg/mL) of TgESAs before LPS stimulation at 100 ng/ml for 1 h. Values are mean ± standard deviation of three independent experiments. *P < 0.05 and **P < 0.01 compared with untreated group (0 μg/ml TgESAs plus LPS).

