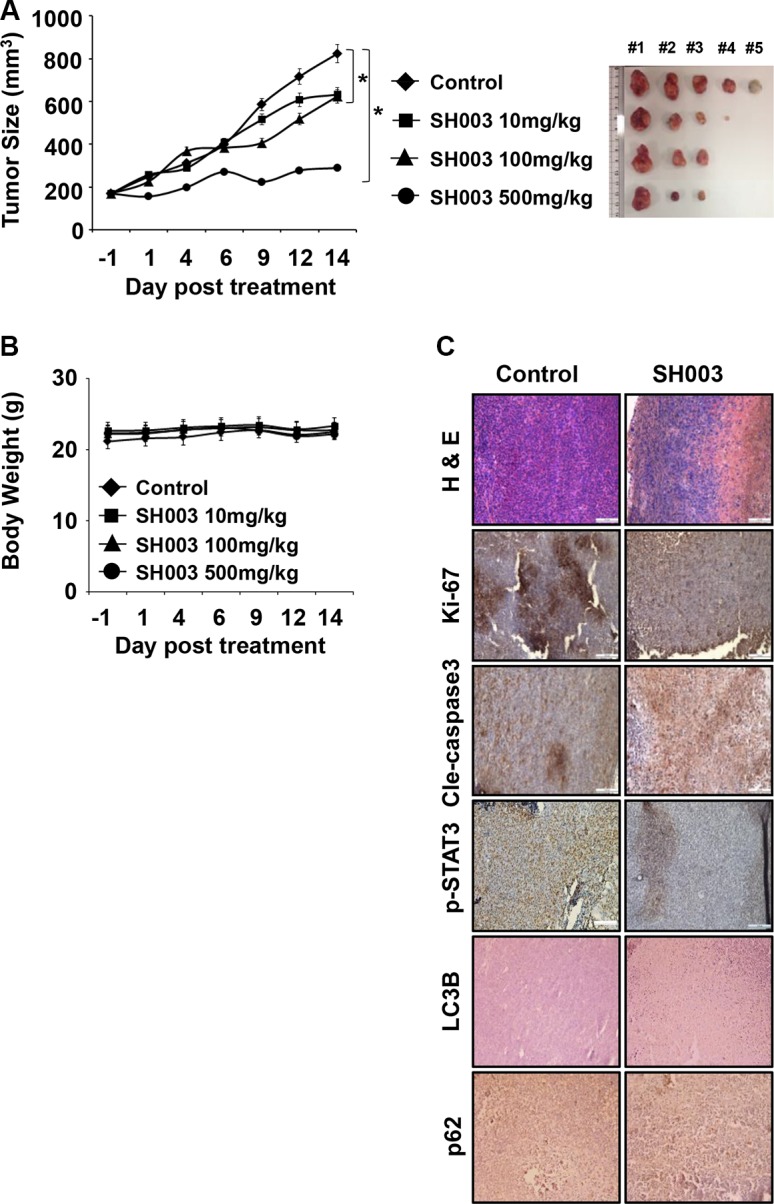
Figure 8. SH003 suppresses in vivo tumor growth.

(A) 5 × 10⁵ MDA-MB-231 cells were s.c. injected and mice (n = 5/group) were p.o. administrated daily with different concentrations of SH003 (10, 100 and 500 mg/kg) for 15 days. Xenograft tumor volumes and body weight of mice were measured three times a week. Tumor volumes were calculated using the following: Tumor volume (cubic millimeters) = width2 × length/2. Data were analyzed by ANOVA with P < 0.05. (B) Body weight (C) Tumor tissues were stained with hematoxylin, eosin and antibodies indicated (anti-Ki-67, -Cleaved caspase 3, -p-STAT3, -LC3B and -p62). Images were obtained at 20× magnification. The scale bar indicates 100 μm. Bars indicate means that standard deviations (SD).
