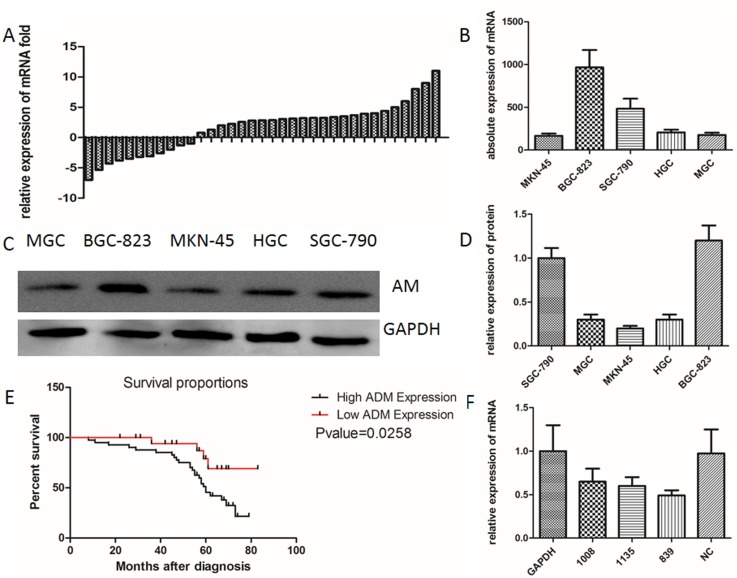
Figure 2.
(A) qRT-PCR results showing the AM mRNA levels in 35 gastric cancer specimens. (B) Relative AM mRNA levels in the gastric cancer cell lines examined. (E) Survival analysis of the 60 clinical patients (P-value=0.0258). (C) Western blot showing the expression level of AM in the gastric cancer cell lines BGC-823, MKN-45, SGC-790, HGC, and MGC. (D) Gray-scale scanning histogram of the (C). (F) qRT-PCR AM mRNA levels in transfected BGC-823 cells.

