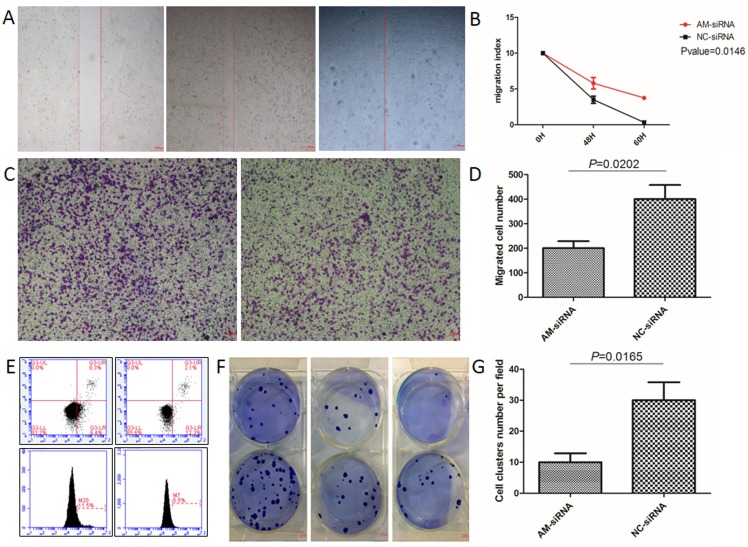
Figure 3. BGC-823 cells transfected with AM siRNA-839.
(A) Wound healing assay (left, 0 h control group; middle, siRNA-839 60 h group; right, siRNA-GAPDH 60 h). (B) Quantitative analysis of (A) (P-value=0.0146). (C) Trans-well migration assay (left, siRNA-GAPDH experimental group; right, siRNA-839 control group). (D) Quantitative analysis of (C). The data represent the mean ± SEM (P-value=0.0202). (E) Annexin V/PI staining (left, basic level of cell apoptosis; right, siRNA-839 cell apoptosis rate. (F) Colony forming assay (top, siRNA-839 experimental group; bottom, siRNA-GAPDH control group). (G) Quantitative analysis of (F). The data represent the mean ± SEM (P-value=0.0165).

