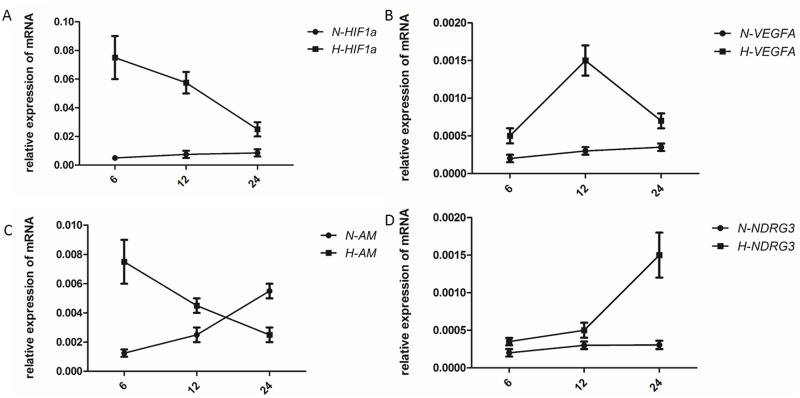
Figure 5. Induction of hypoxia in gastric cancer BGC-823 cells.
(A) Relative mRNA levels of AM, VEGFA, NDRG3, and HIF-1α following hypoxia treatment. The control group was treated using normal culture conditions in parallel. Charts (A, B, C, and D) show HIF1a, VEGFA, AM, and NDRG3, respectively. Expression levels of each target mRNA are expressed relative to GAPDH levels.

