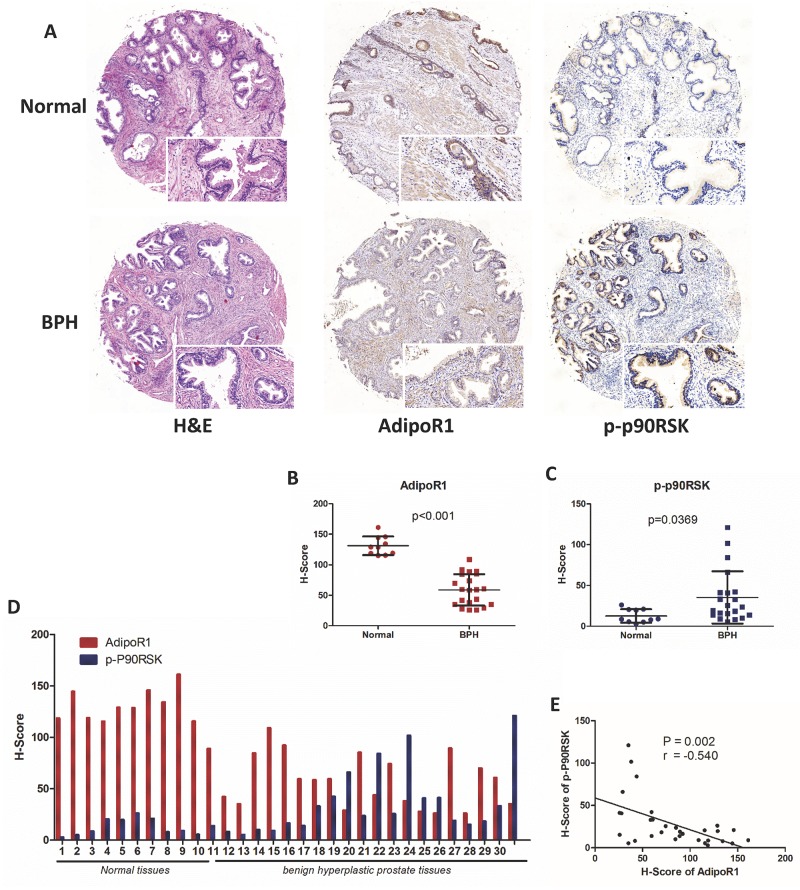
Figure 2. Expression of AdipoR1 and phospho-p90RSK in normal and BPH tissues.
(A) Analysis of tissue microarray (Biomax Inc, PR807b, containing 10 normal prostate tissues and 21 BPH tissues). H&E staining and IHC staining for AdipoR1 and phospho-p90RSK. Scale bars, 100 μm and 200 μm. (B, C) The relative expression of AdipoR1 (p<0.001) and phospho-p90RSK (p=0.0369) between normal and BPH tissues (Mann-Whitney test). IHC staining was semi-quantitated by H-Score as described in the Methods section. (D) Expression of AdipoR1 and phospho-p90RSK on each sequential core. The results are presented as the H-Score. (E) Linear correlation analysis of AdipoR1 and phospho-p90RSK expression (n=31; Pearson’s correlation coefficient, r=-0.540; p=0.002).

