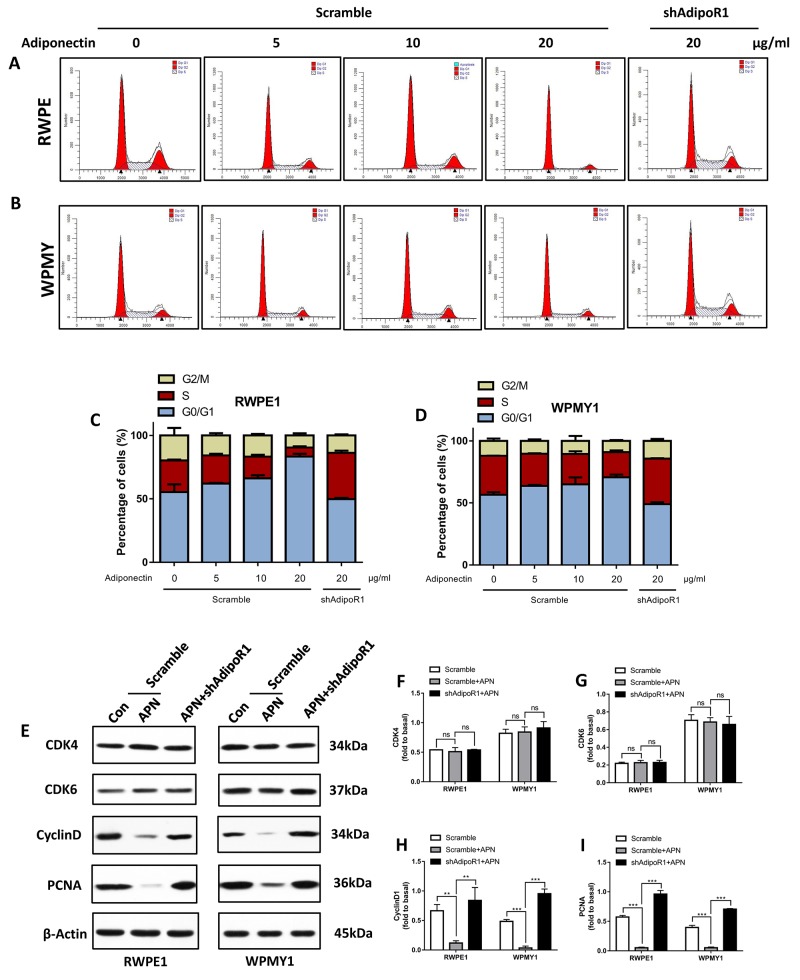
Figure 4. Adiponectin arrests prostatic cells in the G0/G1 phase.
(A, B) Flow cytometry analysis of the cell cycle of RWPE1 and WPMY1 cells with transfection after the addition of different concentrations of adiponectin. (C, D) The cell cycle distribution was further analyzed using ModFit LT software. The results are expressed as the mean±s.d. of three independent experiments. (E) Cells were incubated with 10 ng/ml EGF for 1 h followed by adiponectin treatment (APN) or PBS (Con) for 2 h. Then, the cellular extracts were analyzed for expression of CDK4/6, cyclinD1 and PCNA. (F, G, H, I) Quantification for expression of CDK4/6, cyclinD1 and PCNA. The results are expressed as the mean±s.d. of three independent experiments (one-way analysis of variance followed by Bonferroni post-tests; **p<0.01, ***p<0.001, ns, not significant).

