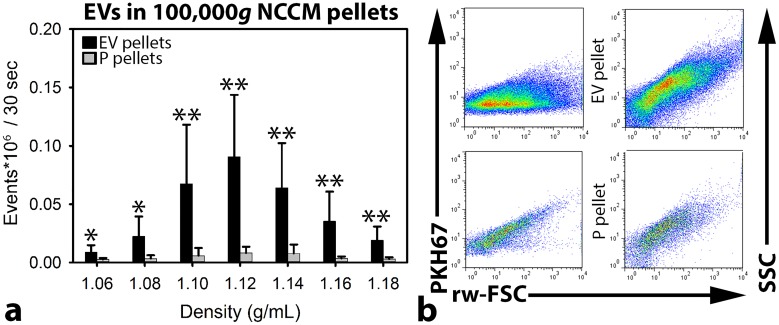
Figure 2. Quantitative extracellular vesicle (EV) analysis by high-resolution flow cytometry of notochordal cell-conditioned medium (NCCM).
(a) Number of measured events per sucrose gradient fraction (with different densities) (+ SD) from floated porcine NCCM EV 100,000g ultracentrifugation (UC) pellets (black bars) and floated protein (P) 100,000g UC pellets (grey bars). *,**: significantly more measured events per 30 sec in the sucrose gradient fractions of the EV 100,000g UC pellets than in those of the P 100,000g UC pellets (p<0.05, p<0.01, respectively). (b) Dot plots of the sucrose gradient fraction with the highest number of measured events (density 1.12 g/mL) from one representative donor (donor 2). Dot plots represent levels of PKH67 intensity (left) or side scatter (SCC; right) (y-axis) versus reduced wide-angle forward scatter (rw-FSC) (x-axis). Upper dot plots represent the 1.12 g/mL sucrose fraction of the EV 100,000g UC pellet, and lower dot plots represent the 1.12 g/mL sucrose fraction of the P 100,000g UC pellet. n = 7 porcine NCCM donors.

