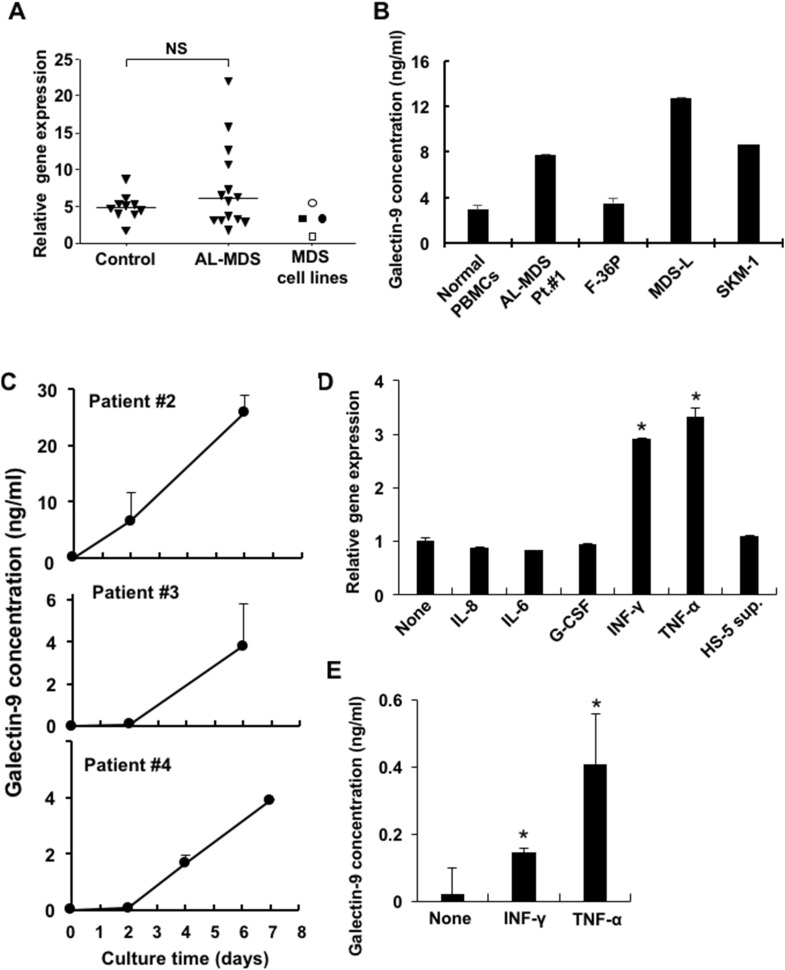
Figure 4. Expression and soluble form of galectin-9 in MDS patients and MDS cell lines.
(A) Galectin-9 mRNA in PBMCs obtained from healthy controls, AL-MDS patients (blasts >95%), and MDS cell lines was determined by real-time PCR. Open rectangle, F-36P; closed rectangle, MDS-L; open circle, HNT-34; closed circle, SKM-1. NS, not significant. (B) Soluble galectin-9 in cell culture supernatant of normal PBMCs (n = 3), patient blasts and MDS cell lines were determined by ELISA. 1 x 10⁶ cells/ml of MDS blasts or normal PBMCs and 2 x 10⁵ cells/ml of MDS cell lines were cultured in complete medium and the culture supernatants were harvested after 2 and 3 days of culture, respectively. (C) 1 x 10⁶ cells/ml of PBMCs obtained from AL-MDS patients were cultured and then the galectin-9 concentrations in culture supernatants acquired on days 2 and 6 (patients #2, #3) and days 2, 4, and 7 (patient #4) were analyzed using ELISA. (D) 2 x 10⁵ cells/ml of F-36P cells were co-cultured with each the following cytokines for 2 days: 5 ng/ml of IL-8, 5 ng/ml of IL-6, 100 pg/ml of G-CSF, 10 ng/ml of IFN-γ, and 500 U/ml of TNF-α and HS-5 sup. Then galectin-9 mRNA expression was evaluated using real-time PCR. (E) Galectin-9 concentrations in the cell culture supernatant of F-36P cells treated with IFN-γ and TNF-α were quantified by ELISA. Data represent mean ± SD. *P<0.05 compared with the results without HS-5 sup. or cytokines (D, E).

