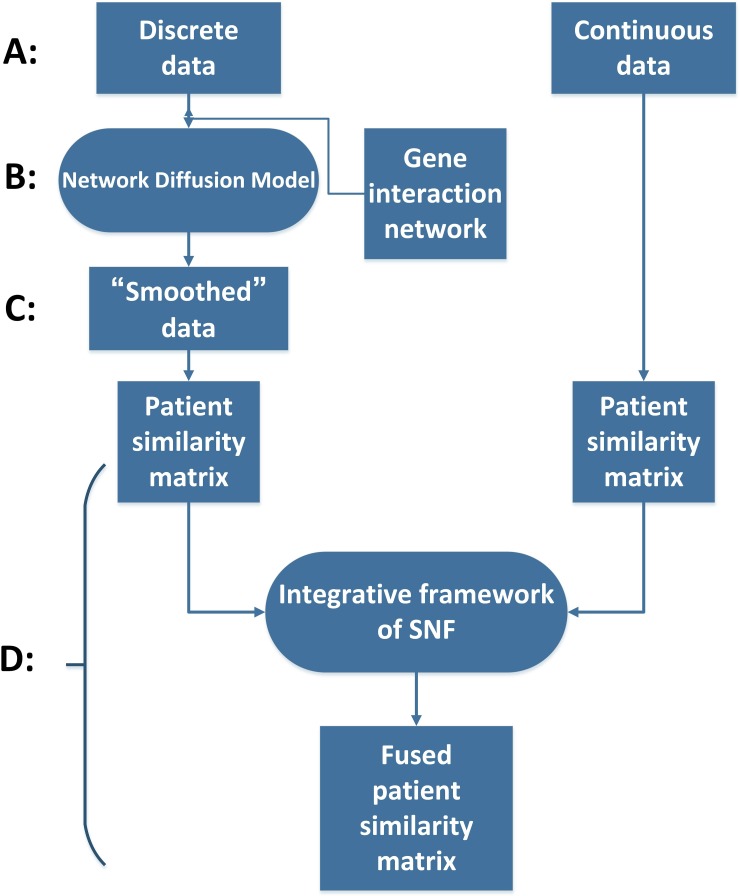
Figure 1. The flow chart of ndmaSNF.
(A) Dividing data into two main categories. (B) Pre-process for data types with discrete value via network diffusion model incorporating gene interaction network. (C) “Smoothed” mutation data. (D) All of these patient similarity matrices derived from various data types were combined into one fused patient similarity matrix through integrative framework of SNF.

