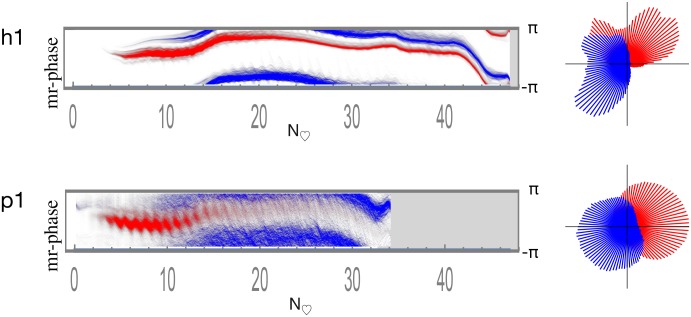
Fig 9. Arterial and venous motion-referenced phase histograms.
Pixels classified by ATOF as arterial are in red and those as venous in blue. Relative histogram count is represented as brightness. The horizontal axis is time is depicted in heartbeats to facilitate human-piglet comparison. The vertical axis is phase ranging as [−π, π]. Arterial versus venous phase appears approximately fixed in difference across the entire bolus passage. The circular phase histograms on the right are calculated by summing the time-indexed phase histograms on the left across time.

