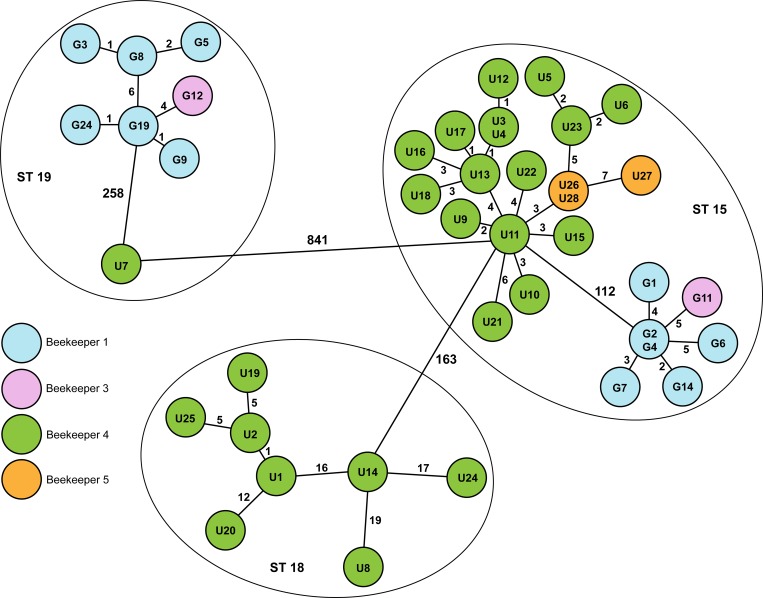
Fig 2. Core genome MLST results of ERIC I-type isolates from AFB outbreaks on Gotland (G) and from Uppland (U).
Minimum spanning tree generated in SeqSphere+ based on comparing the 3,052 genes present in the assemblies of the isolates. The numbers represent the numbers of allele differences between groups of isolates. The lengths of the lines are not proportional to the number of differences. The colors indicate the origin of the isolates (the beekeeper/owner of the apiaries). The circles show which MLST sequence type the isolates belonged to. The minimum spanning tree should not be over-interpreted as showing transmission routes, only the level of relatedness.

