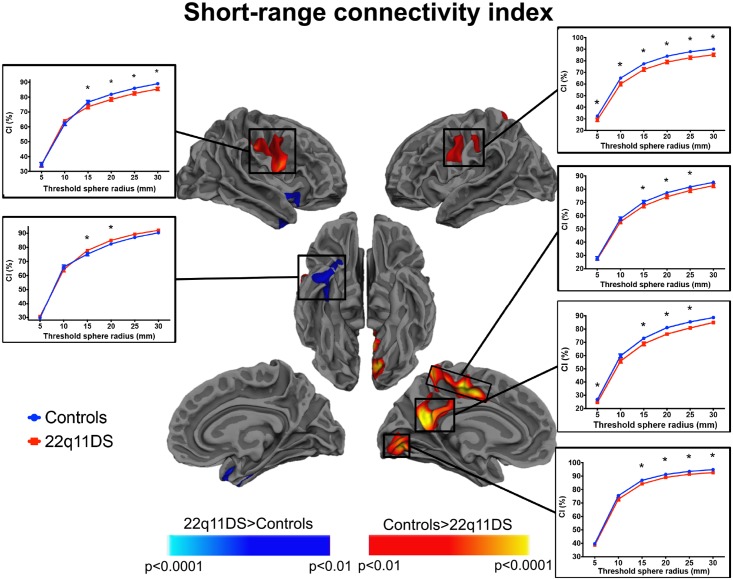
Fig 6. Between-group differences in short-range connectivity.
The cortical maps represent statistical significance at p<0.01 (corrected) using a threshold of 20 mm to define the proportion of short-range connections. The plots, further depict values and significance of the CIshort at different thresholds ranging from 5 to 30 mm. We observed mainly clusters of reduced short connectivity in patients compared to controls (red/yellow). The cluster of increased CIshort (blue scale) in patients did not remain significant after correcting for the white matter volume. The * indicate that the CIshort significantly differed between controls and 22q11DS participants at that threshold.

