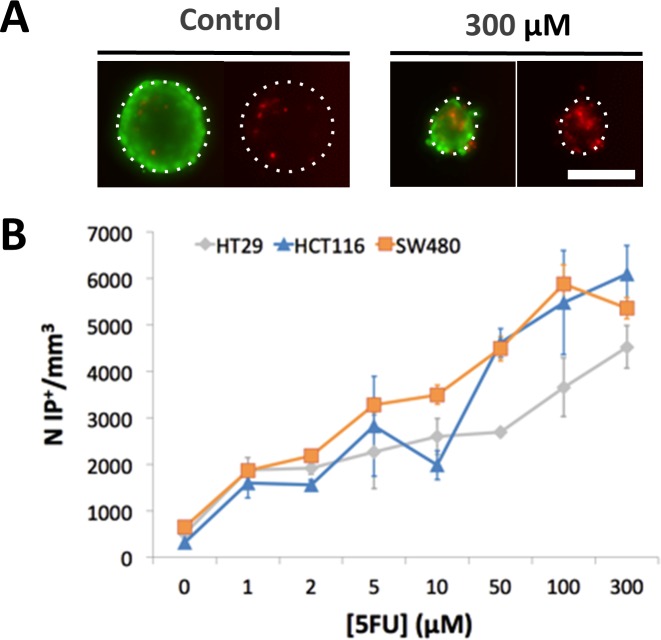
Fig 5. Number of dead cells within the cohesive core of MCTS under drug treatment after transfer to new wells.
(A) Typical fluorescence images at 48h of living cells in green (calcein +) and dead cells in red (PI+) in control SW480 MCTS or in presence of 5-FU (300 μM). (B) Quantification of PI+ dead cells per unit volume for each cell line as a function of the 5-FU concentration. Error bar = SEM (standard error of the mean), (n = 12 for each cell line). Scale bar: 200 μm.

